Download
1 / 27
270 likes | 377 Views
Linking In situ Measurements, Remote Sensing, and Models to Validate MODIS Products Related to the Terrestrial Carbon Cycle. Warren B. Cohen USDA Forest Service. Stith T. Gower University of Wisconsin. David P. Turner Oregon State University. Steven W. Running University of Montana.

E N D
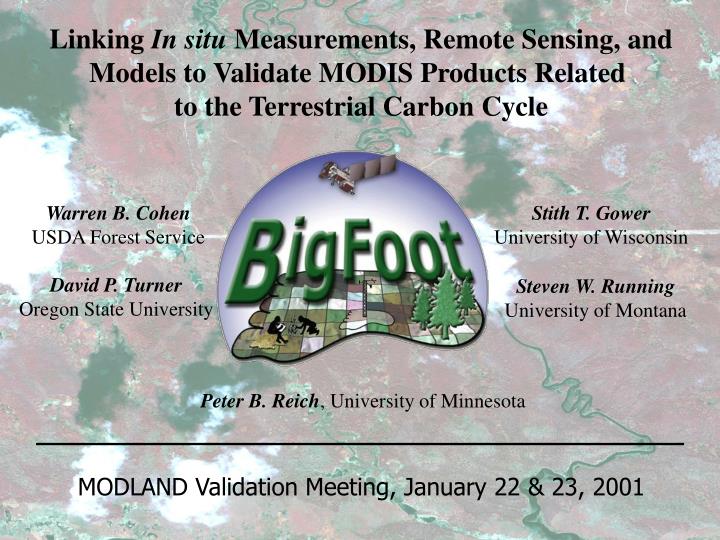
Linking In situ Measurements, Remote Sensing, and Models to Validate MODIS Products Related to the Terrestrial Carbon Cycle Warren B. Cohen USDA Forest Service Stith T. Gower University of Wisconsin David P. Turner Oregon State University Steven W. Running University of Montana Peter B. Reich, University of Minnesota MODLAND Validation Meeting, January 22 & 23, 2001
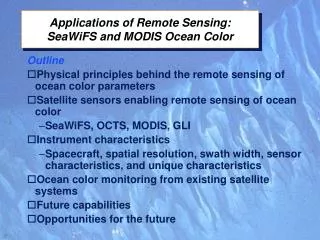
Objectives (MODIS Validation & Ecological Science) • Provide high quality, site-specific data • layers at several sites that can be • compared to MODIS and other sensor • products (land cover, LAI, NPP) • Develop better understanding of the • climatic and ecological controls on total • net primary production and carbon • allocation within and among biomes • Learn how flux tower-measured NEE • and field-measured NPP co-vary in time • & how to translate between them using • ecological models • Explore errors and information losses • that accrue when generalizing detailed • ecological information through remotely • sensed data and models
Sites BOREAS Northern Old Black Spruce (NOBS) muskeg (open black spruce), “closed” black spruce, aspen, wetlands Harvard Forest (HARV) LTER mixed hardwoods, eastern hemlock, red pine, old-field meadow Konza Prairie Biological Station (KONZ) LTER tallgrass, shortgrass, shrub, gallery forest; grazing and burning regimes Bondville Agricultural Farmland (AGRO) corn, soybeans
Field-Based Sampling Design 100 25m2 plots 80 in a nested spatial series 20 plots broadly distributed Plot measurements Vegetation cover LAI, fAPAR Aboveground biomass Aboveground productivity Belowground productivity
Ecosystem properties (e.g, LAI) • highly variable in space • Tower footprints not • necessarily representative of • greater site area • Specific crop types can have • very different productivity levels • A given crop can vary in • productivity among years
2000 AGRO Overall Accuracy: 95% July August
ETM+ predictions of Aug. LAI Corn LAI=4.00+0.45*CCIca R2=0.63 Soy LAI=3.44+0.49*CCIsa R2=0.27 ETM+ predictions of July LAI Corn LAI=4.41+0.63*CCIcj R2=0.61 Soy LAI=1.54+0.49*CCIsj R2=0.58 Crop- and measurement date-specific indices derived from canonical correlation analyses of 4-date (April-September) ETM+ spectral trajectories 1:1 1:1 RMSE=0.45 Slope=0.99 Intercept=0.01 R=0.95 RMSE=0.71 Slope=0.92 Intercept=0.27 R=0.57
Non-burned area error matrix RMSE=1.19 Slope=1.00 Intercept=0.10 R=0.74 RMSE=9.09 Slope=0.98 Intercept=1.46 R=0.84 1:1 1:1 Canonical indices ETM+ March, June Canonical indices ETM+ March, June
BigFoot MODLAND NOBS July
BigFoot MODLAND NOBS July
July AGRO BigFoot MODLAND
July AGRO BigFoot MODLAND August
MODIS GPP Product GPP (gC m-2 d-1) = PAR * fAPAR * g Where: PAR = from DAO climate model fAPAR= from MODIS reflectances g ( gC MJ-1) = GPP / APAR MODIS g from lookup table Spatial Resolution is 1 km Temporal Res. is 8-day mean
Final Points • Anticipated quantitative comparisons with MODIS products • Direct map-to-map comparisons (e.g., freq. dist. fine- vs. coarse-grained • landcover classes; mean/SD of LAI/fAPAR/NPP/GPP//tree cover); • cell, site, multi-site • Evaluate effects of generalization on modeled productivity estimates by • successive coarsening of site-specific detail (land cover IGBP/6-class; • grain size 1 km; (following land cover generalization) • BigFoot data are freely available via Mercury with minimal • delay • 21 datasets thus far (field data, derived surfaces, climate data)
Tasseled Cap Correlations: DN vs. Reflectance; Landsat 5 vs. Landsat 7 L5 exoatmospheric reflectance to L5 DN Brightness: 0.99, Greenness: 0.99, Wetness: 0.95 L5 COST reflectance to L7 COST reflectance Brightness: 0.97, Greenness: 0.96, Wetness: 0.93