Download
1 / 20
200 likes | 206 Views
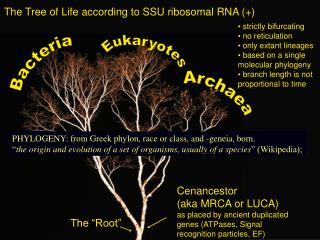
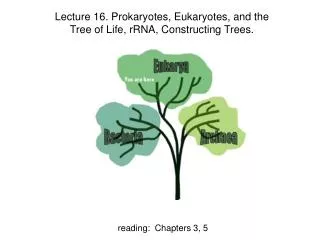
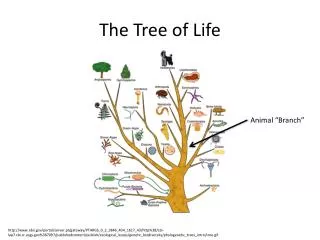
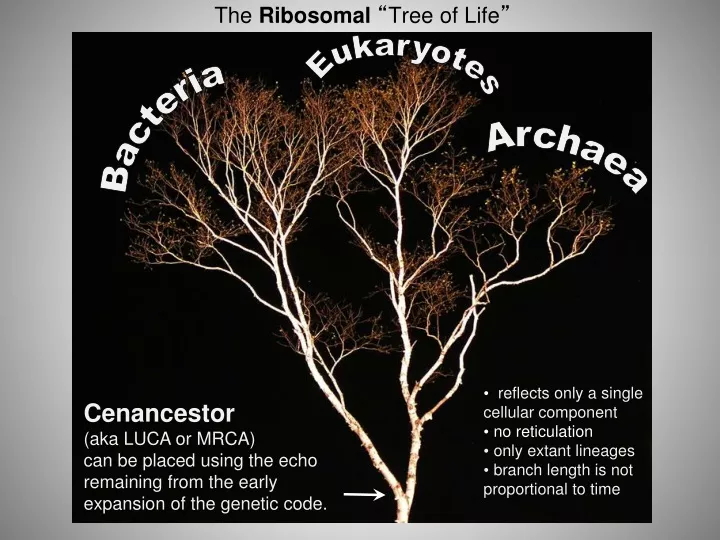
Eukaryotes. Bacteria. Archaea. The Ribosomal “ Tree of Life ”. reflects only a single cellular component no reticulation only extant lineages branch length is not proportional to time.

E N D
Eukaryotes Bacteria Archaea The Ribosomal “Tree of Life” • reflects only a single cellular component • no reticulation • only extant lineages • branch length is not proportional to time Cenancestor (aka LUCA or MRCA) can be placed using the echo remaining from the early expansion of the genetic code.
C C C c c B B b b b A a a a a I III IV V II D -> d C -> c B -> b A -> a
C C C c c B B b b b A a a a a I III IV V II D -> d C -> c Shared derived characters (aka synapomorphies) define monophyletic groups B -> b A -> a
D D D D d C C C c c B B b b b I III IV V II D -> d C -> c Shared primitive characters (aka symplesiomorphies) define paraphyletic groups B -> b A -> a
D D D D d C C C c c B B b b b A a a a a I III IV V II D -> d Characters that are not shared, even if they are derived (as the autapomorphy d), do not provide phylogenetic information. C -> c B -> b A -> a
Terminology • Branches, splits, bipartitions • In a rooted tree: clades • Mono-, Para-, polyphyletic groups, cladists and a natural taxonomy The term cladogram refers to a strictly bifurcating diagram, where each clade is defined by a common ancestor that only gives rise to members of this clade. I.e., a clade is monophyletic (derived from one ancestor) as opposed to polyphyletic (derived from many ancestors). (Note: you need to know where the root is!) A clade is recognized and defined by shared derived characters (= synapomorphies). Shared primitive characters (= sympleisiomorphies , alternativie spelling is symplesiomorphies) do not define a clade. (see in class example drawing ala Hennig). To use these terms you need to have polarized characters; for most molecular characters you don't know which state is primitive and which is derived (exceptions:....).
More Terminology Related terms: autapomorphy = a derived character that is only present in one group; an autapomorphic character does not tell us anything about the relationship of the group that has this character ot other groups. homoplasy = a derived character that was derived twice independently (convergent evolution). Note that the characters in question might still be homologous (e.g. a position in a sequence alignment, frontlimbs turned into wings in birds and bats). paraphyletic = a taxonomic group that is defined by a common ancestor, however, the common ancestor of this group also has decendants that do not belong to this taxonomic group. Many systematists despise paraphyletic groups (and consider them to be polyphyletic). Examples for paraphyletic groups are reptiles and protists. Many consider the archaea to be paraphyletic as well. holophyletic = same as above, but the common ancestor gave rise only to members of the group.
Coalescence – the process of tracing lineages backwards in time to their common ancestors. Every two extant lineages coalesce to their most recent common ancestor. Eventually, all lineages coalesce to the cenancestor. t/2 (Kingman, 1982) Illustration is from J. Felsenstein, “Inferring Phylogenies”, Sinauer, 2003
Coalescence ofORGANISMALandMOLECULAR Lineages Time • 20 lineages • One extinction and one speciation event per generation • One horizontal transfer event once in 5 generations (I.e., speciation events) • RED: organismal lineages (no HGT) • BLUE: molecular lineages (with HGT) • GRAY: extinct lineages • RESULTS: • Most recent common ancestors are different for organismal and molecular phylogenies • Different coalescence times • Long coalescence time for the last two lineages
Y chromosome Adam Mitochondrial Eve Lived approximately 50,000 years ago Lived 166,000-249,000 years ago Thomson, R. et al. (2000) Proc Natl Acad Sci U S A 97, 7360-5 Underhill, P.A. et al. (2000) Nat Genet 26, 358-61 Cann, R.L. et al. (1987) Nature 325, 31-6 Vigilant, L. et al. (1991) Science 253, 1503-7 Albrecht Dürer, The Fall of Man, 1504 Adam and Eve never met The same is true for ancestral rRNAs, EF, ATPases!
EXTANT LINEAGES FOR THE SIMULATIONS OF 50 LINEAGES Modified from Zhaxybayeva and Gogarten (2004), TIGs 20, 182-187
Lineages Through Time Plot 10 simulations of organismal evolution assuming a constant number of species (200) throughout the simulation; 1 speciation and 1 extinction per time step. (green O) 25 gene histories simulated for each organismal history assuming 1 HGT per 10 speciation events (red x) log (number of surviving lineages) green: organismal lineages ; red: molecular lineages (with gene transfer)
The deviation from the “long branches at the base” pattern could be due to • under sampling • an actual radiation • due to an invention that was not transferred • following a mass extinction Bacterial 16SrRNA based phylogeny(from P. D. Schloss and J. Handelsman, Microbiology and Molecular Biology Reviews, December 2004.)