Download
1 / 56
570 likes | 834 Views
Pregnant Women and Infants. Jamie S. Kim November 6, 2009. MCH 2015 Needs Assessment. www.integrativehealthinstitute.ca. Target Population. All pregnant women and infants in Kansas Infant : A child under one year of age.

E N D
Pregnant Women and Infants Jamie S. Kim November 6, 2009 MCH 2015 Needs Assessment www.integrativehealthinstitute.ca
Target Population All pregnant women and infants in Kansas • Infant: A child under one year of age. • Pregnant woman: A female from the time that she conceives to 60 days after birth, delivery, or expulsion of fetus. However, many states also include the preconceptional health of a women in her reproductive years (e.g., 15-44 years).
Goal To enhance the health of Kansas women and infants in partnership with families and communities. ccstockton.net
MCH2010 Priority Needs are: • Increase early and comprehensive health care before, during and after pregnancy. • Reduce premature births and low birth weight • Increase breastfeeding
Increase early and comprehensive health care before, during and after pregnancy
HP2010 16-6b. Percent of pregnant women who receive early and adequate prenatal care (APNCU) Desired Direction=Above Line Healthy People 2010 (90%) nativeremedies.com Data Source: Bureau of Public Health Informatics; National Center for Health Statistics
NPM18. Percent of infants born to pregnant women receiving prenatal care beginning in the first trimester Desired Direction=Above Line Healthy People 2010 (90%) preconception.com NPM: National Performance Measure Data Source: Bureau of Public Health Informatics; National Center for Health Statistics
HP2010 16-11a. Percent of total preterm births (<37 weeks) Desired Direction=Below Line www.marchofdimes.com Healthy People 2010 (7.6%) Data Source: Bureau of Public Health Informatics; National Center for Health Statistics Note: U.S. data for 2007 is preliminary.
HP2010 16-11a. Percent of live births at 32 to 36 weeks of gestation (moderately premature and late preterm) Desired Direction=Below Line ok.gov Healthy People 2010 (6.4%) Data Source: Bureau of Public Health Informatics; National Center for Health Statistics
Percent of live births at 34 to 36 weeks of gestation (late preterm) cincinnatichildrens.org Data Source: Bureau of Public Health Informatics; National Center for Health Statistics
HP2010 16-11a. Percent of live births at less than 32 weeks of gestation (very premature) Desired Direction=Below Line Extremely preterm infant born at 26 weeks' gestation archive.student.bmj.com Healthy People 2010 (1.1%) Data Source: Bureau of Public Health Informatics; National Center for Health Statistics
HSI1A. Percent of live births weighing less than 2,500 grams (LBW). Desired Direction=Below Line www.askamum.co.uk Healthy People 2010 (5.0%) HSI: Health Status Indicator Data Source: Bureau of Public Health Informatics; National Center for Health Statistics U.S. data for 2007 is preliminary.
HSI1B. Percent of live singleton births weighing less than 2,500 grams (LBW). archive.student.bmj.com HSI: Health Status Indicator Data Source: Bureau of Public Health Informatics; National Center for Health Statistics
HSI2A. Percent of live births weighing less than 1,500 grams (VLBW). Desired Direction=Below Line tobaccolabels.ca Healthy People 2010 (0.9%) HSI: Health Status Indicator Data Source: Bureau of Public Health Informatics; National Center for Health Statistics
HSI2B. Percent of live singleton births weighing less than 1,500 grams (VLBW). jillstanek.com HSI: Health Status Indicator Data Source: Bureau of Public Health Informatics; National Center for Health Statistics
HP2010 16-19a. Percent of mothers who breastfeed their infants in early postpartum period (at hospital discharge). Desired Direction=Above Line Healthy People 2010 (75%) Data Source: National Immunization Survey (birth year)
NPM 11, SPM3, HP2010 16-19b. Percent of mothers who breastfeed their infants at 6 months. Desired Direction=Above Line Healthy People 2010 (50%) dsf.health.state.pa.us NPM: National Performance Measure; SPM: State Performance Measure Data Source: National Immunization Survey (birth year)
NPM 11, SPM3, HP2010 16-19b. Percent of mothers who breastfeed their infants at 1 year. Desired Direction=Above Line Healthy People 2010 (25%) babble.com NPM: National Performance Measure; SPM: State Performance Measure Data Source: National Immunization Survey (birth year)
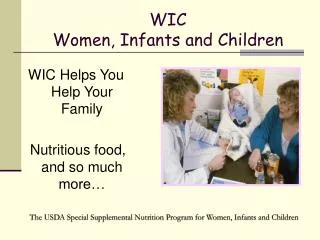
Percent of mothers participating in WIC who breastfeed their infants in early postpartum period (at hospital discharge). Desired Direction=Above Line Healthy People 2010 (75%) Data Source: Pediatric Nutrition Surveillance System (PedNSS)
Percent of mothers participating in WIC who breastfeed their infants at 6 months. Desired Direction=Above Line Healthy People 2010 (50%) Data Source: Pediatric Nutrition Surveillance System (PedNSS)
Percent of mothers participating in WIC who breastfeed their infants at 1 year. Desired Direction=Above Line Healthy People 2010 (25%) Data Source: Pediatric Nutrition Surveillance System (PedNSS)
NPM 11, SPM3, HP2010 16-19b. Percent of mothers who breastfeed their infants at 6 months. Desired Direction=Above Line Healthy People 2010 (50%) NPM: National Performance Measure; SPM: State Performance Measure Data Source: National Immunization Survey (birth year); Pediatric Nutrition Surveillance System (PedNSS)
Kansas Pregnant Women and Infants Selected Characteristics/Indicators
Population Characteristics coolest-homemade-costumes.com
Population Composition by MCH groupings, Kansas and U.S., 2008 Data Source: U.S. Census Bureau
MCH Populations as a Percent of Total Population, Kansas and U.S., 2008 U. S. Kansas Data Source: U.S. Census Bureau
Women (ages 15-44) by Race and Ethnicity, Kansas and U.S., 2008 Kansas U. S. Data Source: U.S. Census Bureau Note: The percentage distribution of U.S. Black NH, Nat. Am. NH, Asian/PI NH, and Multiple Race NH are approximations.
Percent of prepregnancy overweight and obesity, Kansas and U.S., 2003-2007 Data Source: Pregnancy Nutrition Surveillance (PNSS)
Percent of women (ages 18-44) without health care coverageKansas and U.S., 2002-2007 Data Source: Behavioral Risk Factor Surveillance System
Percent of women (ages 18-44) without health care coverageKansas, 2002-2007 Data Source: Behavioral Risk Factor Surveillance System
Pregnancy Outcomes theonion.com
Crude Birth Rate Kansas and U.S., 2002-2008 Data Source: Bureau of Public Health Informatics (residence data); National Center for Health Statistics Note: U.S. birth rate for 2007 is preliminary. LB: Number of live births
Crude Birth Rate by Race/EthnicityKansas and U.S., 2007 Data Source: Bureau of Public Health Informatics; National Center for Health Statistics Note: U.S. data for 2007 is preliminary.
Percent of Births to Unmarried WomenKansas and U.S., 2002-2008 Data Source: Bureau of Public Health Informatics; National Center for Health Statistics Note: U.S. data for 2007 is preliminary.
Teen Birth Rate (ages 15-17)Kansas and U.S., 2002-2008 Data Source: Bureau of Public Health Informatics; National Center for Health Statistics Note: U.S. data for 2007 is preliminary.
Teen Pregnancy Rate (ages 15-17)Kansas and U.S., 2002-2008 Data Source: Bureau of Public Health Informatics; National Center for Health Statistics Note: Teen pregnancy include the sum of live births, stillbirths and abortions.
Teen Pregnancy Rate (ages 15-19)Kansas and U.S., 2002-2008 Data Source: Bureau of Public Health Informatics; National Center for Health Statistics Note: Teen pregnancy include the sum of live births, stillbirths and abortions.
Infant Mortality RatesKansas and U.S., 2002-2008 Data Source: Bureau of Public Health Informatics; National Center for Health Statistics Note: U.S. data for 2007 is preliminary.
Infant Mortality Ratesby Race/EthnicityKansas, 2002-2008 Data Source: Bureau of Public Health Informatics
Infant Mortality Ratesby Race/Ethnicity and RatioKansas, 2002-2008 Data Source: Bureau of Public Health Informatics
Kansas Pregnant Women and Infants Highlights Based on the most recent years of available data http://www.datacounts.net/mch2015/
Highlights • In 2008, Women of childbearing age (15-44) and infants comprise 21.3% of Kansas population. • In 2008, 41,815 live births occurred to Kansas residents, representing a birth rate of 14.9 per 1,000 population. • In 2008, Geary (25.8), Seward (24.4), and Ford (21.7) counties had the highest county birth rates per 1,000 population.
Highlights • In 2006, birth rates (14.8) in Kansas are among the highest (ranked 14th) in the nation (US 14.2). • In 2006, Kansas teen (ages 15-19) birthrate (42.0) is about the same as the national average (41.9) – Ranked 17th. • In 2008, Kansas non-Hispanic black (97.6/1,000) and Hispanic(121.1) teenagers (ages 15-19) are over twice and three times, respectively, as likely to get pregnant as non-Hispanic white teens (42.2).