Download
1 / 88
910 likes | 1.18k Views
The Future of Work. Small Business Panel Occupational Safety and Health Administration 2 July 2009 John Howard, MD, MPH, JD Public Health Law Program Centers for Disease Control and Prevention U.S. Department of Health and Human Services Washington, D.C . . Changes to the Future of Work.

E N D
The Future of Work Small Business Panel Occupational Safety and Health Administration 2 July 2009 John Howard, MD, MPH, JD Public Health Law Program Centers for Disease Control and Prevention U.S. Department of Health and Human Services Washington, D.C.
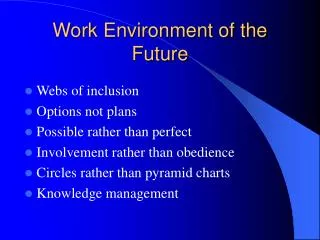
Changes to the Future of Work • Workforce • Age • Gender • Culture • Employment • Precarious • Benefits • Global & Virtual • Hazards • New Technologies • Organization of Work • Stress
Occupational Safety and Health Act • “Congress declares it to be its purpose and policy … • To assure as far as possible every working man and woman in the Nation safe and healthful working conditions and • To preserve our human resources--” • By providing for research in the field of occupational safety and health, including the psychological factors involved, and by developing innovative methods, techniques, and approaches for dealing with occupational safety and health problems.”
Growing Shortage of U.S. Workers Expected Labor Force and Labor Force Demand Millions of People Source: Employment Policy Foundation analysis and projections of Census/BLS and BEA data.
1970-2010 2010-2050 Screeching to a Halt:Growth in the Working-Age Population Mexico Brazil India China South Australia Canada US Netherlands Spain France UK Russia Italy Japan Germany Korea Source: Deloitte Research/UN Population Division (http://esa.un.org/unpp/) It’s 2008: Do You Know Where Your Talent Is? Why Acquisition and Retention Strategies Don’t Work, p.6
Dramatically Different Patterns of Growth by Age Percent Growth in U.S. Population by Age: 2000-2010 3. Rapid growth in the over-55 workforce 2. Few younger workers entering Age of Workers 1. Declining number of mid-career workers Source: U.S. Census Bureau
. . . Continuing Into the Future Percent Growth in U.S. Workforce by Age: 2000-2020 Age of Workers Source: U.S. Census Bureau
5% to 12.4% Under 5% 12.5% to 20% Above 20% In 2000, A Fairly “Young” World . . . Percent of Population Age 60+ in 2000 Source: U.S. Census Bureau
5% to 12.4% Under 5% 12.5% to 20% Above 20% . . . Rapidly Aging by 2025 Percent of Population Age 60+ in 2025 Source: U.S. Census Bureau
Why? Dramatic Increase in Life Expectancy Average Life Expectancy at Birth in the U.S. 80 75 70 65 60 55 50 45 40 1900 1910 1920 1930 1940 1950 1960 1970 1980 1990 2000 Source: U.S. Social Security Administration
“Sudden” Boom in Life Expectancy Life Expectancy at Birth: 1000 - 2000 Age Source: U.S. Census Bureau, 2000
And a Dramatic Drop in Birth Rates Total Fertility Rate: 1960 ▀ and 2000 ▀ Total Fertility Rate Source: Age Wave
1990 1980 1970 1960 1950 1940 1930 Why? The Baby Boom Pattern The Boom Years: 1946-1964 4.5 4.0 3.5 Birth in Millions 3.0 2.5 2.0 Source: U.S. Census Bureau International Data Base
Skill Mismatch Ahead in the U.S. • Over the next decade, only 30% of US 20 year/olds will obtain a college degree, but 2/3’s of new jobs will require a college degree • Key skill sets will be in critically short supply: • # students that declared their major in computer science has declined for past 4 years—now 39% lower than in 2000 • Other shortages: engineering, physical & biological sciences • A growing number of high school dropouts • Fewer high school graduates with vocational training • Labor “imports” decreasing due to security restrictions and opportunities in rapidly developing countries Source: In part, The Seventh-Annual Workplace Report, Challenges Facing the American Workplace, Summary of Findings,” Employment Policy Foundation, 2002; India Daily, October 12, 2005, citing McKinsey & Co. Research; Computing Research Association, March 2005; Information Week, August 16, 2004; Holding on to Global Talent: Foreign-born stars are heading home. How to keep them working for you” by Anne Fisher, Fortune Magazine, October 19, 2005. Organization for Economic Co-operation and Development
When I was growing up, my parents used to say to me, "Tom, finish your dinner. People in China and India are starving." Today I tell my girls, "Finish your homework. People in China and India are starving for your jobs." —Thomas Friedman, The World is Flat Source: “The New York Times' Thomas Friedman on Globalization,” CIO Magazine, March 25, 2005
Chronologically older Limited availability Key skills lacking Global & Virtual Diverse Race Gender Age Generations Culture U.S. 21st Century Workforce Challenges Source: Testimony by Tamara J. Erickson to the U.S. Senate Committee on Health, Education, Labor and Pensions, May 2005
Average Retirement Age of Males 68 1960 1995 67.2 66.5 66 66.5 66.2 66.2 65.2 64.5 64 64.5 63.6 62.7 62.3 62 60 60.6 60.5 59.2 58 56 France Germany Italy Canada UK US Japan Source: Center for Strategic and International Studies
“Multi-Generational” Workforce Traditionalist Boomer Generation X Generation Y Born: 1980-2000 Born:1965-1980 Born:1928-1945 Born:1946-1964 Four generations (cultures) are being asked to coexist in the early 21st century workplace Source: Based in part on “Meeting the Challenges of Tomorrow's Workplace,” CEO Magazine, 2005
1992 2002 Falling Desire for Jobswith Greater Responsibility Source: Generation & Gender in the Workplace, An Issue Brief by Families and Work Institute
Declining Desire for Jobs with Greater Responsibility By Gender Employees Wanting Jobs with Greater Responsibility Men Women Source: Generation & Gender in the Workplace, An Issue Brief by Families and Work Institute
Lower Alignment with the Organization Source: The New Employee/Employer Equation, The Concours Group and Age Wave, 2004
Webster's Definition of Retirement • to disappear • to go away • to withdraw Source: Webster's New Twentieth Century Dictionary
0 10 20 30 40 50 60 70 80 Shifting the Old Work/Life Paradigm . . . Age Education Work Leisure Source: Demography is De$tiny, The Concours Group and Age Wave, 2003
0 10 20 30 40 50 60 70 80 Age . . . To a “Cyclic” Life Paradigm Education Work Leisure Source: Demography is De$tiny,The Concours Group and Age Wave, 2003
0 10 20 30 40 50 60 70 80 Age . . . Evolving to a “Blended Lifestyle” Education Work Leisure Source: Demography is De$tiny, The Concours Group and Age Wave, 2003
Cutting Back Has New Meaning: Cyclic Work The most popular pattern for working after “retirement” is not part-time, but moving back and forth between periods of working and not working. Source: The New Employee/Employer Equation, The Concours Group and Age Wave, 2004
More Years Spent in “Retirement” After Your First Corporate Career 30 + 20-25 19.4 13.6 Years 1.2 Source: Age Wave, based on U.S. data, and The Concours Group
Aging Productively“Older Workers on the Move: Recareering in Later Life,” by R. Johnson, J Kawachi & E. Lewis of the Urban Institute for the AARP Public Policy Institute
Impact on Occupational Safety and Health Senior Executives The changing demographics in the workforce mean that we all need to be thoughtful about how to age and work productively Human Resource Leaders EMPLOYEES Front Line Managers
National Research Council Study (2004)Commissioned by NIOSH ● Characterize the older adult workforce over next 20-30 years ● Identify the key policy and research issues ● Address retirement patterns and characteristics of the older adult workforce and their jobs ● Conduct workshop on differential effects of environmental hazards
National Research Study (2004) • Life course perspective emphasizes aging productively versus age • Beginning clearly to detect age-related changes • Can address disease risk factors to extend years of healthy living • Promote research to capture precursors of age-related changes
Proportion of 50 yr-olds Still Employed at Subsequent Agesby Age Attained and Class (U.S.) US Bureau of Census 1981-2000
Aging: A Balance of Factors • Possible Limitations • Mental Capacity • Chronic Conditions • Physical Capacity • Compensating Factors? • Attitude • Judgment • Flexibility • Interest in learning new things
Mental Capacity Does long work experience advantage older workers in thinking through problems in comparison to new workers? Can older workers be trained in new technologies? Is the modern workplace too complex or too technical for the older workers? Do older workers bring more experiential intelligence to the job?
Mental Capacity • Laboratory Tests • Cognition speed • Information retrieval slower, unless material is familiar • Learning and recall slower, but equally successful in the end • Greater retention, higher learning achievement and more likely to complete a new field of study than younger workers
Mental Capacity: Relevance to On-the-Job Performance • Lab tests do not translate well to actual work settings • Factors other than psychometric cognitive abilities appear important to perform well at work • How well worker gets along with co-workers • Desire to perform well • Individual measures are quite sensitive to occupational class
Diagnoses Among Disability Female Pensioners by Age(Sweden 1990-1993) Höög & Stattin, 1996
Physical Capacity: Can Older Workers Keep Up? • Physiology • Maximal strength at 20-30 years • O2 uptake reduced to 70% (max) by 65 years • Older adults work closer to capacity • Match Ability to Job Requirements • Change in industry from manufacturing to services • Change in job duties from physical to mental
Work Settings:Employing Older Workers • Decreased performance • For physically demanding work only • Work uncommonly demands maximal effort • Non-physical advantages that older workers bring to a job are rarely measured • Workers abilities matched to the job results in less morbidity • Accommodation thinking rare in industry1 • May change with ADA Amendments Act of 2008 • Workers are changing (aging) and jobs are changing 1 Eur J App Phys 2003 89:536
Trends in Workplace Physical Stressors As the U.S. service sector increases and manufacturing jobs decrease, are physical stressors decreasing in US jobs?
Exposure to Physical StressorsEU - 1990-2000 Working Conditions in the EU – Euro. Fnd.
Exposure to Physical Hazards (EU)By Type of Work Contract (1995) Working Conditions in the EU – Euro. Fnd.
Aging Productivity • Injury risk and its consequences differ in older workers • Medical costs rise with age • Estimated 25% increase from age 40 to 50 to 35% from age 50 to 60 • BUT, age is less a factor in health care costs than the presence of such risk factors as smoking, obesity, lack of exercise, and diabetes! • There is such a thing as “aging productively” or “healthy aging”!
Essentials • Do aging workers need special accommodations? • A well-designed workplace benefits everyone • Work stations and job tasks need to be matched to the capacity of each worker • There should be no conflict between ergonomic principles vs. reasonable accommodations • Are there any specific health and safety concerns related to aging workers? • Older workers have fewer injuries, but when one occurs, that injury tends to be more severe and it takes worker longer to get better. • Injuries differ in older workers—there are more musculoskeletal injuries (especially involving the low back) • No consistent relationship between aging and work performance!
Future Research Needs • Conduct Longitudinal Studies of Older Workers • Impact of work risks on older workers • Interactions with chronic health conditions • Socio-Economics Status relationships to: • Hazardous employment • Retirement decisions and barriers to continued work • Surveys • Update National Occupational Exposure Survey (NIOSH and OSHA) • Develop a new Quality of Employment Survey (NIOSH and OSHA) • Develop ability to measure rates by age, gender and ethnicity (BLS) • Aging Productively Management Programs
Older Workers: Some Best Practices and Strategies for Engaging and Retaining Older WorkersGAO-07-433T February 28, 2007 • Key Obstacles • Employer perceptions • Age discrimination • Strong financial incentives to retire • Jobs with inflexible schedule or unmodified physical demands • Best Practices • Non-traditional recruiting techniques • Flexible work schedules • Adapt to “retirement” schedules • Strategies • Make federal government model employer for older workers • Consider specific legislation