Download
1 / 27
340 likes | 658 Views
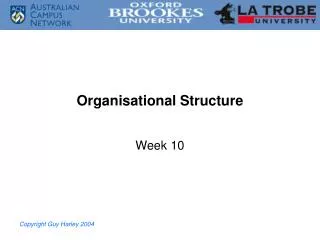
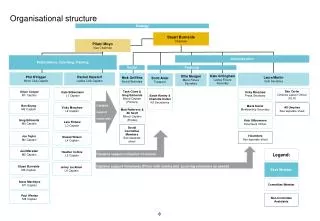
Organisational Structure. Bidfood. Bidvest Australasia. Bidserv. Bidvest Europe. Bidfreight. Bid Industrial & Commercial Products. Bid Prop. Corporate. Bid Auto. Bidpaper Plus. Historic Performance. 5.2%. 5.2%. 5.2%. 4.9%. 4.9%. 4.9%. 4.8%. 4.8%. 4.8%. 4.7%. 4.7%. 4.5%.

E N D
Organisational Structure Bidfood Bidvest Australasia Bidserv Bidvest Europe Bidfreight Bid Industrial & Commercial Products Bid Prop Corporate Bid Auto Bidpaper Plus
Historic Performance 5.2% 5.2% 5.2% 4.9% 4.9% 4.9% 4.8% 4.8% 4.8% 4.7% 4.7% 4.5% 4.9% 4.5% 4.4% 4.9% 4.4% 4.3% 4.4% 17% CAGR over 5 years 17% CAGR over 5 years
Unaudited Results For the six months ended December 31 2006
Agenda • Introduction & Overview • Financial Results • Outlook • Appendices: • Appendix 1: Segmental Outlook • Appendix 2: Divisional Review
Introduction Introduction & OverviewBrian Joffe Group Outlook Segmentals Financials
H1 2007 Highlights Introduction
H1 2007 results summary Introduction
Introduction Segments at the forefront of performance Revenue (Rm) Trading Profit (Rm)
Segments at the forefront of trading performance Introduction • Bidserv:up 17%, driven by strong results out of TMS, Top Turf, Aviation, Bid Travel and Rennies Bank • Bidvest Australasia:up 44% in ZAR and 25% in AUD, driven organically (Melbourne & Sydney showing promise) • Bid Industrial and Commercial products: up 76%, driven by Voltex and Office Products (marked improvement from Waltons Gauteng) • Bid Auto:up 22%, driven by a 40% increase in Financial Services and an 18% increase in Motor
Segments holding their own Introduction Revenue (Rm) Trading Profit (Rm)
Segments holding their own in trading performance Introduction • Bidfreight:up 12%, profit growth below revenue growth due to lower volumes in Bulk, Ports & Distribution • Bidvest Europe:up 19% in ZAR; flat in sterling; MOD impacts but Deli XL and Horeca did commendably well • Bidfood:up 4%, masks some notably good performances but Bidbake suffers sharp margin erosion • Bidpaper Plus:up 11%, respectable result with Lithotech, Printing & Conversion, and the DRC project worthy of mention
Financials Financial ResultsDavid Cleasby Group Outlook Segmentals Introduction
Financials Consolidated Income Statement Six months ended December 31 2006 H1 2007 in constant currency (R/£ 11.56) Avg R/£13.75 Avg R/£ 11.56 • Real price and volume increases • Includes full 6-month contribution of R4,2bn from Deli XL vs 3 months in previous period (R2,2bn) • 18% excluding exchange translation
Financials Consolidated Income Statement Six months ended December 31 2006 H1 2007 in constant currency (R/£ 11.56) Avg R/£13.75 Avg R/£ 11.56 NOTE:Foreign food businesses = 23.9% (R497,7m) contribution to Trading Income vs 23.2% (R395,1) in H1 2006
Financials Consolidated Income Statement Six months ended December 31 2006 H1 2007 in constant currency (R/£ 11.56) Avg R/£13.75 Avg R/£ 11.56 • Offshore interest of R28,2m vs local interest of R196,8m • Zero net debt offshore vs local net debt of R4,2bn • Strong cash flows have enabled offshore debt repayment, therefore proportionately more debt in SA vs offshore • 200 b.p. prime rate increase
Financials Consolidated Income Statement Six months ended December 31 2006 H1 2007 in constant currency (R/£ 11.56) Avg R/£13.75 Avg R/£ 11.56 Associates: Tiger Wheels, Enviroserv (+38% HEPS), Compu-clearing & other
Financials Consolidated Income Statement Six months ended December 31 2006 H1 2007 in constant currency (R/£ 11.56) Avg R/£13.75 Avg R/£ 11.56
Financials Consolidated Income Statement Six months ended December 31 2006 H1 2007 in constant currency (R/£ 11.56) Avg R/£13.75 Avg R/£ 11.56 Namsov ↓ Versalec ↑ BidAuto ↑
HEPS - Total weighted avg shares in issue of 299 566:Purchased18m shares from Dinatla on 12/12/06 at avg price of R79,38 (vs R60,00 received on 18m options) DPS Distribution policy = +/- 2x covered Financials Consolidated Income Statement Six months ended December 31 2006 H1 2007 in constant currency (R/£ 11.56) Avg R/£13.75 Avg R/£ 11.56
Financials Consolidated Cash Flow Statement – Rm’s Six months ended December 31 2006 Working capital: • Working capital investment required to fund growth, mainly McCarthy, Voltex & Office • Additional working capital invested not generating additional returns yet • General seasonality • OEM cycle • New vehicle registrations • Builders’ annual shutdown
Financials Bidvest net working capital flows vs cash generated - Rbn Net working capital cycle peaks in first half (December) each year
Financials Gearing Target interest cover range • Gearing capacity: • Balance sheet progressively being better utilised • Interest cover of 9.3x; room to decrease to 5-6x if required • Growth into more activities requiring financing, eg. fleet business
Group Outlook Group OutlookBrian Joffe Financials Introduction Group
Other matters Group Outlook • BEE • Dinatla refinancing • Alignment with new BBBEE codes • Ongoing operational focus on transformation • Strategic Investments • Opportunistic & Strategic – build entrepreneurial, strategic stakes from time to time in companies with activities aligned to Bidvest’s activities
Bidvest Group - sensitivity to anticipated economic variables Segmentals • GDP growth:Expected to remain good in all markets • Relative rand weakness:(vs GBP and AUD in H1 2007) is positive on translation (quarter of earnings) and overall neutral to positive for South African trading business in medium term • Mild price inflation:Apparent across all markets; upward pressure on wage and distribution costs and intense competition reinforces efforts to avert margin squeeze • Upward phase of interest rate cycle:Experienced in all geographies served; countered by relatively positive operating conditions • Consumer spending:General confidence levels remain encouraging • Benefit from infrastructure spend:(incl. multiplier benefits) should not be underestimated • SA has experienced none of the extreme economic volatility apparent in earlier times and we see a relatively settled trading outlook OVERALL EFFECT: BROADLY POSITIVE Group
Prospects Group Outlook • Ongoing review of low-return assets • Bidvest Namibia almost born • Benefits of group-wide capex yet to be fully realised • Value extract through group procurement • Focus on organic and acquisitive growth • Within Africa: exploit diverse opportunities • Internationally: food services business expansion Management confident of delivering above-average returns and growth for F2007