Download
1 / 26
260 likes | 395 Views
Impact of Local Interconnects and a Tree Growing Algorithm for Post-Grid Clock Distribution Jiayi Xiao. Paper Titles. Impact of Interconnects on Timing in RLS/SDP Blocks. Local interconnects are believed to cause major impact on timing, power and routability in VLSI design

E N D
Impact of Local Interconnects and a Tree Growing Algorithm for Post-Grid Clock Distribution Jiayi Xiao
Impact of Interconnects on Timing in RLS/SDP Blocks • Local interconnects are believed to cause major impact on timing, power and routability in VLSI design • Interconnects generally affect the timing and power in the following ways • Wire delay • Cell delay degradation • Slope degradation • Delays due to the repeaters
Simulation Environment • A 45nm IA processor (Nehalem) • 86 RTL-to-layout synthesis (RLS) blocks • 133 Semi-manually designed structured data path(SDP) blocks • Focus on the impact of local (intra-block) interconnects • No consideration for intra-standard-cell wire delay (Poly and M1) Source: http://www.anandtech.com/show/2658
Wire Delay • The wire delay contributes to 6% and 5%, respectively, in RLS and SDP blocks Figure 1: Wire-delay on the worst internal paths in (a) synthesized and in (b) semi-manually designed datapath blocks
Cell Delay and Slope Degradation • Often known as secondary effects due to interconnects • Not secondary anymore in nanometer technology • It is 7% (13%) and 5% (9%) in both RLS and SDP blocks Figure 2: Slack improvement percentage due to setting R and C of interconnects to 0 on the worst internal paths in (a) synthesized and in (b) semi-manually designed datapath blocks
Repeater Count due to Interconnects • 43% and 30% repeaters, respectively, in RLS and SDP blocks. Figure 3: Number of repeaters vs. cell count in (a) synthesized and in (b) semi-manually designed datapath blocks
Overall Interconnect Delay Impact Including Repeater Delays • Wires contribute to 33% and 20% of the delay in RLS and SDP blocks • Repeaters contribute to 21% and 10%, respectively Figure 4: Repeater delay percentage vs. slack on the worst critical paths in (a) synthesized and in (b) semi-manually designed datapath blocks
Power In Clock Interconnects and Buffers for RLS Blocks • The clock trees including sequentials contribute to 70% of total dynamic power • Only 20% of the cell count • Clock buffers and nets contribute 16% of the dynamic power • Only about 2% of the cell count 14% 16% 40% Figure 5: Distribution of dynamic power in clock trees inside synthesized blocks
Power In Clock Interconnects and Buffers for SDP Blocks • The clock trees including sequentials contribute to 35% of total dynamic power • About 10% of the cell count 5% 6% 23% Figure 6: Distribution of dynamic power in clock trees inside SDP blocks
Impact to Dynamic Power in Combinational Logic for RLS Blocks • The combinational logic dissipates about 27% of the dynamic power • The repeaters (44% of cell count) constitute 30% of dynamic power 32% 30% 68% 70% Figure 7: Distribution of dynamic power in combinational logic for synthesized blocks. (a) Distribution into combinational logic cells and interconnect. (b) Distribution of dynamic power in combinational logic cells into that in repeaters and other cells.
Impact to Dynamic Power in Combinational Logic for SDP Blocks • The combinational logic dissipates about 65% of the dynamic power • The repeaters (27% of cell count) constitute 20% of dynamic power 20% 47% 53% 80% (b) (a) Figure 8: Distribution of dynamic power in combinational logic for SDP blocks. (a) Distribution into combinational logic cells and interconnect. (b) Distribution of dynamic power in combinational logic cells into that in repeaters and other cells.
Conclusion • Local interconnects contribute to more that 1/3 of the delay in RLS blocks and about 1/5 in SDP blocks • RLS blocks have 13% more repeater than SDP blocks • Some secondary effects are not second order • Local interconnects contribute 27% and 35% to the dynamic power in RLS and SDP blocks • The percentage is even higher in clock trees • Power dissipation due to clock interconnects and buffers is a big problem
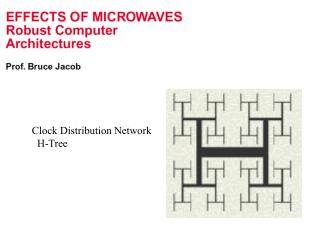
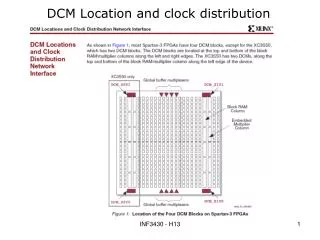
Routing With Constraints for Post-Grid Clock Distribution • In high-performance microprocessors, clocks are distributed employing hybrid networks, containing global grid followed by buffered gated trees Figure 9: (a) Global clock distribution to layout areas employing spines for grid. (b) Clock distribution from grid wires to sequentials in a block inside layout area
Routing With Constraints for Post-Grid Clock Distribution • Clock routing from global grid to buffered gated local clock tree is known as post-grid clock distribution • Traditionally, this routing is carried out manually • Often employing the nearest source heuristic and up-sizing strategy • Very time-consuming and non-optimal Figure 10: Global clock routing topology, with horizontal grid wires and tracks for routing in both directions. (b) Routing solution.
Problem Formulation • A routing graph with three type nodes • Port-nodes(), Via nodes() and Source-nodes () • Constructing a set of trees, so that minimizing , where
Tree Growing Algorithm, Continued Figure 12: Comparison between (b) the nearest source heuristic and (c) tree-growing algorithm
Algorithm Complexity and Delay Model • The time complexity of the algorithm is where are the numbers of port nodes, candidate via nodes and source nodes • The delay checking employs elmore delay model, while the skew is calculated by where is the slope of the waveform at the input of the segment
Conclusion • Massive total wire length reduction • 14% wire length improvement compared to the nearest source heuristic • Great speed improvement • Routing thousands of terminals over area in seconds
References [1] R. S. Shelar, “Routing With Constraints for Post-Grid Clock Distribution in Microprocessors,” IEEE Trans. Comput.-Aided Design Integr. Circuits Syst., vol 29, no. 2, pp.245-249, Feb. 2010. [2] R. S. Shelar and M. Patyra, “Impact of Local Interconnects on Timing and Power in a High Performance Microprocessor,” in Proc. Int. Symp. Physical Design (ISPD), Mar. 2010, pp. 145-152. [3] R. Kumar and G. Hinton. “A family of 45nm IA processors,” in International Solid-State Circuits Conference, pages 58–59, February 2009.