Download
1 / 27
270 likes | 376 Views
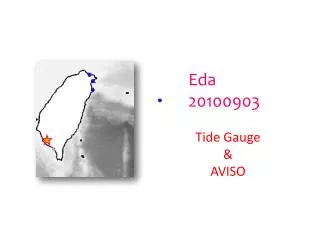
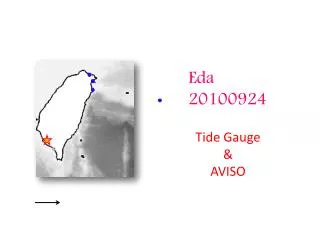
Eda 20100915 Tide Gauge & AVISO. Mean SSH from Rio et al.2009 Black dots are the locations of the tide gauge stations. Blue contours are the isobaths. Time period of data Keelung: 1980-2009 Ishigaki : 1969-2008 Gangfeng : 1997-2007 Suao : 1999-2005 Lanyu:1992-2009 Dawu:2004-2009.

E N D
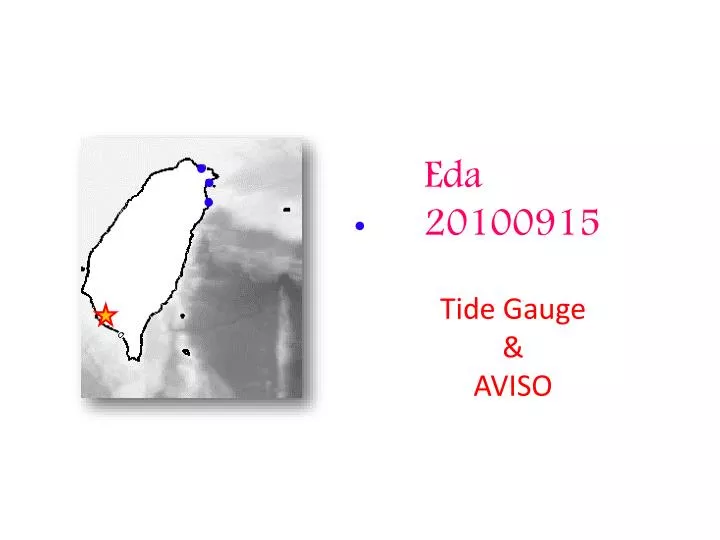
Eda 20100915 Tide Gauge & AVISO
Mean SSH from Rio et al.2009 Black dots are the locations of the tide gauge stations. Blue contours are the isobaths. Time period of data Keelung: 1980-2009 Ishigaki: 1969-2008 Gangfeng: 1997-2007 Suao: 1999-2005 Lanyu:1992-2009 Dawu:2004-2009
outline • EOF (AVISO SSH, ECMWF wind stress, curl) • Mean wind stress and curl • Correlation Coef. , regression and time series of: North Taiwan (tide gauge & AVISO) South Taiwan East Luzon • AVISO SSHA Latitude-Time plot (eddy propagation)
EOF AVISO SSH: 360d running mean mode1: 67% mode2: 7.3% mode3: 3.9 %
Mean wind stress (Pa) and curl (Pa/m) 1980~2008 Wind filed is dominated by winter monsoon
Time series of SSHA Tide gauge (black solid) AVISO (red dash)
Time series of SSHA AVISO: south Taiwan
Time series of SSHA AVISO: east Luzon
Correlation and regression of AVISO SSHA & Tide Gauge North Taiwan
Correlation and regression of AVISO SSHA South Taiwan
Correlation and regression of AVISO SSHA East Luzon
SST (color), SLP (contours) and wind stress (arrows) anomalies during +ve and –ve PDO’s +ve -ve 1990 Comparison: tide gauge and AVISO http://jisao.washington.edu/pdo/