Download
1 / 21
210 likes | 435 Views
Multi-scale Simulation of tsunami from Tohoku Earthquake and Diffracted Tsunami Waves in Hokkaido. ZHU AIYU, Zhang Dongning Institute of Geophysics, China Earthquake Administration Yuen Dave A. University of Minnisota Song Shenyi Computer Network Information Center, China Academy of Science.

E N D
Multi-scale Simulation of tsunami from Tohoku Earthquake and Diffracted Tsunami Waves in Hokkaido ZHU AIYU, Zhang Dongning Institute of Geophysics, China Earthquake Administration Yuen Dave A. University of Minnisota Song Shenyi Computer Network Information Center, China Academy of Science
Governing equations and numerical methods Numerical simulation Tsunami diffraction Generation Propagation Runup Inundation Outlines
Governing equations 2D nonlinear shallow water equations Numerical methods Finite volume method (clawpack) bottom frictional terms
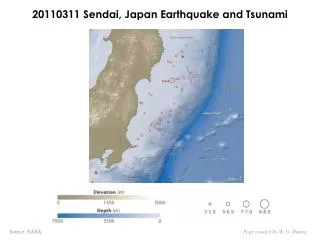
longitude from 135° to 160°E latitude from 30 ° to 45°N DART 21401, DART 21413, DART 21418 and DART 21419 Computing Domain http://www.ndbc.noaa.gov/dart.shtml
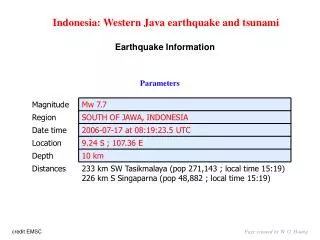
length L=510km width W=150km the fault dips δ=14˚ rakes λ=81˚ strikes θ=193˚ average slip D=20m Generation • The first source model Figure 1 The tsunami source model based on USGS
Figure 5 Offshore DART buoys wave height records versus computed results of the F1 model Figure 5 Offshore DART buoys wave height records versus computed results of the F1 model
The second source model (a) (b) consists in a 190 sub-faults system Figure 3 (a) Surface projection of the slip distribution superimposed on ETOPO2 (http://www.geol.ucsb.edu/faculty/ji/big_earthquakes/2011/03/0311_v3/Honshu.html); (b) The tsunami source model based on UCSB
Figure 6 Offshore DART buoys wave height records versus computed results of the F2 model
The third source model • finite element method, • uses the GPS data for constrain condition Figure 3 The tsunami source model of GPS
Figure 7 Offshore DART buoys wave height records versus computed results of the F3 model
Which is the best source model ? • The arrival times of the first wave, the results of F2 and F3 gives have a generally better agreement with the observed data, but not for case of F1 that is much slower than the observation. • The amplitude of the first wave, all of the model have there bad side and good side It is indeed difficult to distinguish which one is the best
Table 1 the correlation relation of the different models • correlation coefficient The second source model is the best!
Grid is 1800×3000 • Propagation Visualized by Avizo Characters: (1) The tsunami wave is split into two waves, one is towards to the northeast coast of Japan, Another wave faces to the Pacific Ocean (2) tsunami wave is that first arriving wave is negative and then the positive wave which agrees with the observed data.
runup Table 2 Maximum run-up values for calculated and observed values http://www1.kaiho.mlit.go.jp/KANKYO/TIDE/real_time_tide/sel/index_e.htm the notation * means the maximum height of tsunami cannot be retrieved so far due to the troubles, and actual maximum height might be higher according to the observed data
Adaptive mesh refinement method • Inundation
movie Tohoku tsunami diffraction
Add the Gaussian noise to the topography Topography Topography add Gauss noise
No flooding phenomenon at Hokkaido Island ? Possible reason • The earthquake source is not exactly correct • The shallow water equations are not a perfect model for the wave motion, • The 1-mintute resolution etopo ocean bathymetry is maybe not fine enough • The Gaussian noise maybe not appropriate