Download
1 / 8
80 likes | 221 Views
Long Term Analysis of 20 MHz Solar Radio Events P. Mason, M. Villarreal, Dr. C. Higgins MTSU Department of Physics and Astronomy.

E N D
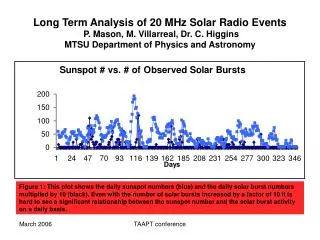
Long Term Analysis of 20 MHz Solar Radio Events P. Mason, M. Villarreal, Dr. C. HigginsMTSU Department of Physics and Astronomy Figure 1: This plot shows the daily sunspot numbers (blue) and the daily solar burst numbers multiplied by 10 (black). Even with the number of solar bursts increased by a factor of 10 it is hard to see a significant relationship between the sunspot number and the solar burst activity on a daily basis. TAAPT conference
Weekly 20.1 MHz and sunspot # 175 150 125 100 75 50 25 0 Date 8/9/05 9/8/05 1/6/06 6/10/05 6/25/05 7/10/05 7/25/05 8/24/05 9/23/05 10/8/05 11/7/05 5/26/05 12/7/05 1/21/06 3/27/05 4/11/05 4/26/05 5/11/05 10/23/05 11/22/05 12/22/05 20.1 MHz burst count (x10) Sunspot Number 2/5/06 2/20/06 Figure 2: The weekly plot of sunspot numbers versus solar burst numbers multiplied by 10 shows a slightly more noticeable correlation between the sunspot numbers and solar burst numbers. TAAPT conference
Figure 3 (above): A plot of the bi-monthly averages of sunspot numbers and the solar radio bursts shows a good correlation. TAAPT conference
Figure 4 (right): The best fit line through the scatter plot of intensity versus duration of the bursts shows a direct relationship. (Not all data shown) TAAPT conference
This graph displays the sunspot numbers over an approximate 11 year solar cycle (cycle 23). The dotted lines represent the upper and lower predicted thresholds, the smooth white line represents the smoothed monthly values. The maximum solar activity, as in all solar cycles, is in the middle of the cycle. This is when the magnetic flux inside the sun is at its highest. TAAPT conference
Figure 5: A comparison plot of the solar radio flux at 10.7 cm with the sunspot number over a period of 54 years. This comparison illustrates that the periodicity of the sunspot number matches the solar radio flux at 10.7 cm. Solar Radio flux graph, retrieved from The National Research Council of Canada http://www.drao-ofr.hia-iha.nrc-cnrc.gc.ca-icarus/www/maverplot.html Sunspot Number Graph retrieved from Marshall Space Flight Center http://www.science.msfc.nasa.gov TAAPT conference
Fluctuations in both daily sunspot and solar radio burst numbers are very high, so correlations are not as evident. (Figure 1) • The data (Figures 2 & 3) suggests a strong correlation between the numbers of observed sunspots and the number of observed solar radio bursts. • As expected, we found that the intensity and duration of the solar bursts were related. With a few exceptions, the more intense bursts tended to have longer durations (Figure 4). • This data covers a 12 month period. It is expected that a longer term comparison of 20 MHz data would show a strong correlation with the solar sunspot number and, therefore, the solar cycle. TAAPT conference