Download
1 / 23
360 likes | 1.68k Views
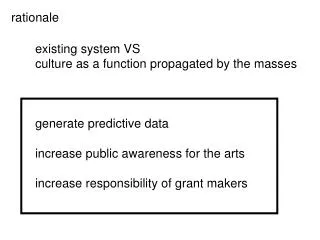
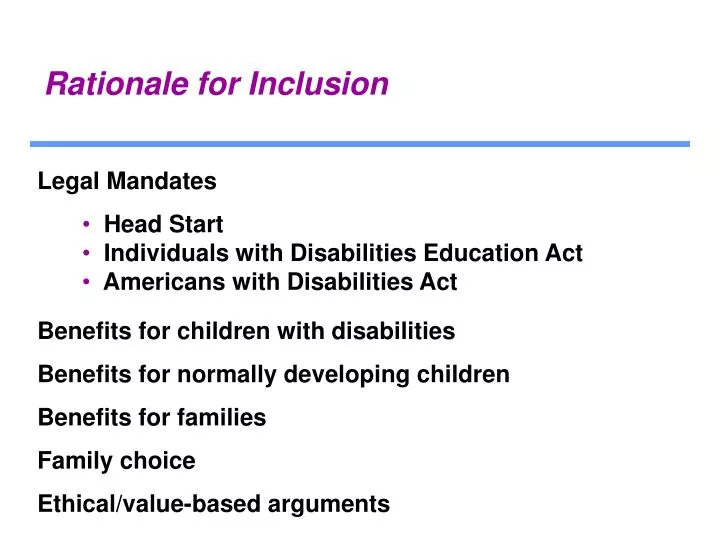
Rationale for Inclusion. Legal Mandates Head Start Individuals with Disabilities Education Act Americans with Disabilities Act. Benefits for children with disabilities Benefits for normally developing children Benefits for families Family choice Ethical/value-based arguments.

E N D
Rationale for Inclusion • Legal Mandates • Head Start • Individuals with Disabilities Education Act • Americans with Disabilities Act Benefits for children with disabilities Benefits for normally developing children Benefits for families Family choice Ethical/value-based arguments
Promoting Inclusion & Normalization • Strong support for preschool inclusion comes from four sources • - legislation - moral arguments • -rational arguments - research • Inclusion practices vary as a function of state practices & child characteristics • Under current conditions, inclusion sometimes competes with other important values • high-quality services • specialized services • family-centered practices
U.S. Department of Education, Office of Special Education, Data Analysis System (DANS). (November 1999) Table AB7. Retrieved September 21, 2000, from Data Tables for OSEP State Reported Data [IDEA Part B Child Count (1998-99)] on the World Wide Web: http://www.ideadata.org/arc_toc.html#partbLRE
Percentage of Children 3 Through 5 Served in Different Educational Environments (97-98 School Year) • U.S. Department of Education, Office of Special Education, Data Analysis System (DANS). (November 1999) Table AB3. Retrieved September 21, 2000, from Data Tables for OSEP State Reported Data [IDEA Part B Child Count (1998-99)] on the World Wide Web: http://www.ideadata.org/arc_toc.html#partbLRE
Percentage of Infants and Toddlers Served Under Part C in Different Early Intervention Settings (as reported on December 1, 1997) • U.S. Department of Education, Office of Special Education, Data Analysis System (DANS). (November 1999) Table AH7. Retrieved September 21, 2000, from Data Tablesfor OSEP State Reported Data [IDEA Part B Child Count (1998-99)] on the World Wide Web: http://www.ideadata.org/arc_toc.html#partbLRE
Comparison of Educational Environments for Children 3 Through 5 Receiving Special Education: Most Inclusive and Least Inclusive States(1997-98 School Year) Separate Facility Combination of Regular/Pull-out Combination of Regular/Pull-out 2.9% Separate Classroom 5.46% 10.09% 9.48% Separate Facility 16.74% Separate Classroom 48.34% Regular Class 82.16% Regular Class 29.83% 8 states with the highest percentage of 3 through 5 served in regular settings 8 states with the lowest percentage of 3 through 5 served in regular settings. • U.S. Department of Education, Office of Special Education, Data Analysis System (DANS). (November 1999) Table AB3. Retrieved September 21, 2000, from Data Tables for OSEP State Reported Data [IDEA Part B Child Count (1998-99)] on the World Wide Web: http://www.ideadata.org/arc_toc.html#partbLRE
Summary of Research on Social Outcomes of Integrated Versus Segregated Settings Number of Studies
Summary of Research on Developmental Outcomesof Integrated versus Segregated Settings
Many children are in preschool programs of inadequate quality Only a few children have access to care of the highest quality
Determinants and Outcomes of Quality in Integrated Preschool Outcomes for children with disabilities Contextual Features Program Features Family Characteristics Child Characteristics Outcomes of Integration Outcomes for families of children with disabilities Outcomes for others
Values that Sometimes Compete with Inclusion • High-quality services • Specialized services • Family-centered practices
Tension Between Specialization and Normalization High Specialization Ideal Typical Low Normalization High Normalization Typical Low Specialization
Inclusive Settings for Children with Disabilities Can Pose Special Challenges for Families • Most parents desire normalized settings for their children. • Many families feel a tension between specialization and normalization. • Normalization in one setting can lead to disruption in other settings. • Families often try to balance inclusive and specialized • experiences; the way this is accomplished varies considerably • across families. • Inclusion of children does not necessarily lead to inclusion of • parents.
Goal Inclusion of children with disabilities in normalized settings that are of high quality, consistent with family preferences & capable of supporting each child’s unique learning needs • We must • Improve quality of community child care • revise regulations & funding options • build individual, program & community support for inclusion • create structures to support inclusion efforts • consider inclusion in the broader context of normalization
Proposed Normalization Goal • To teach skills and provide supports that • Enable persons with disabilities and their families to live lives that are as normal as possible; and • Promote self-determination
What would it take to achieve this goal? • Improve the quality of community child care • Revise regulations and funding options • Build individual program and community support for inclusion • Create structures to support inclusive efforts • Consider inclusion in the broader context of normalization
What do we know about Quality? • Long history of effects of parenting style, poverty, home environments • 20 yrs of research showing quality matters • Higher quality = better outcomes • Quality affects cognitive, language, social • Effects of quality persist • Quality matters for all children, but is especially important for poor children and children of mothers with low education
Characteristics of High-Quality Programs • High staff-child ratio • Small group size • Adequate staff education and training • Low staff turnover • Curriculum emphasizing active learning • Emotionally warm and caring relationships among teachers and children • Parent support and involvement
How Might Early Intervention Be Different if Normalization Became the Primary Theme? • Child assessment might focus on skills needed • to function or participate in family-identified routines and activities. • Assessmentmight include a focus on parental goals in various domains of family life. • Children might be taught skills in the context/settings in which parents feel they are most important.
How Might Early Intervention Be Different if Normalization Became the Primary Theme? (cont’d) • Inclusion in regular preschool might become part of a larger area of consideration for normalized experiences. • Family support might focus on helping families achieve what they feel is a normalized life for them. • Quality of life for families might become a critical indicator of the effectiveness of early intervention.
Some Goals for Early Intervention • Promote development in key domains • Build and support children’s social competence • Promote child engagement, independence & mastery • Provide and prepare for normalized life experiences • Support families • Prevent secondary consequences of disabilities • Promote quality of life for children and families
Typical Inclusion Goal To ensure that children with disabilities are fully included in regular classes.
References • Bailey, D. B., McWilliam, R. A., Buysse, V., & Wesley, P. W. (1998). Inclusion in the context of competing values in early childhood education. Early Childhood Research Quarterly, 13, 27-47. • Buysse, V., & Bailey, D. B. (1993). Behavioral and developmental outcomes in young children with disabilities in integrated and segregated settings: A review of comparative studies. Journal of Special Education, 26, 434-461. • U.S. Department of Education, Office of Special Education, Data Analysis System (DANS). (November 1999) Tables AB3, AB7, AH7. Retrieved September 21, 2000, from Data Tables for OSEP State Reported Data [IDEA Part B Child Count (1998-99)] on the World Wide Web: http://www.ideadata.org/arc_toc.html#partbLRE