Download
1 / 8
80 likes | 209 Views
Supplemental Appendix TRAIL (TNF Related Apoptosis Inducing Ligand) Regulates Adipocyte Metabolism by Caspase-mediated Cleavage of PPARgamma Running title : TRAIL affects metabolism of fat cells

E N D
Supplemental Appendix TRAIL (TNF Related Apoptosis Inducing Ligand) Regulates Adipocyte Metabolism by Caspase-mediated Cleavage of PPARgamma Running title: TRAIL affects metabolism of fat cells Authors: Michaela Keuper 1, Ingrid Wernstedt Asterholm 2, Philipp E. Scherer 2, Mike-Andrew Westhoff 3, Peter Möller 4, Klaus-Michael Debatin 3 , Gudrun Strauss 3, Martin Wabitsch 1, Pamela Fischer-Posovszky 1 Affiliations: 1Division of Pediatric Endocrinology, Diabetes and Obesity Unit, Department of Pediatrics and Adolescent Medicine, Ulm University Medical Center, Ulm, Germany 2 Touchstone Diabetes Center, University of Texas Southwestern Medical Center, Dallas, TX, USA 3 Department of Pediatrics and Adolescent Medicine, Ulm University Medical Center, Ulm, Germany 4 Institute of Pathology, Ulm University Medical Center, Ulm, Germany Correspondence / reprint requests: Dr. Pamela Fischer-Posovszky, Pediatric Endocrinology and Diabetes, Department of Pediatrics and Adolescent Medicine, University of Ulm, Eythstr 24, 89075 Ulm, Germany, tel.: +49 731 500 57400, fax.: +49 731 500 57412 email: pamela.fischer@uniklinik-ulm.de
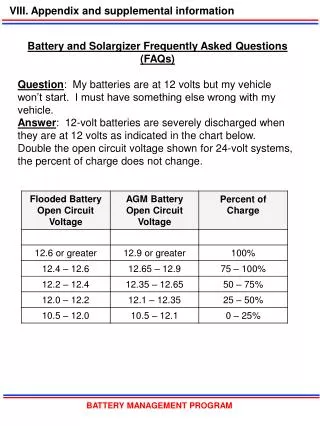
Figure S1 1,8 1,6 1,4 1,2 1,0 TRAIL-R1 mRNA 0,8 0,6 0,4 0,2 0,0 0 4 7 11 14 (d) of adipgenic differentiation 1,2 1,0 0,8 TRAIL-R1 mRNA 0,6 0,4 0,2 0,0 0 4 7 11 14 (d) of adipgenic differentiation 40 35 30 25 FASN mRNA 20 15 10 5 0 0 4 7 11 14 (d) of adipgenic differentiation * * * * * * * * * Figure S1: Expression of TRAIL receptors during adipogenic differentiation SGBS preadipocytes were differentiated into adipocytes. Total RNA was prepared on d0, 4, 7, 11 and 14 of adipogenic differentiation and reversely transcribed. qPCR analysis was performed using primer pairs specific for TRAIL-R1 (A) and TRAIL-R2 (B). FASN (C) was studied as a control for adipogenic differentiation. Data are represented as relative amount of mRNA expression normalized to GAPDH are presented as mean + SEM of three independent experiments. * p< 0.05 (d0 vs day 4, 7, 11, or 14 of adipogenic differentiation)
Figure S2 Figure S2: TRAIL inhibits insulin-stimulated de novo lipogenesis in human primary fat cells Human primary ex vivo differentiated fat cells were treated with 100 ng/ml TRAIL or vehicle. After 24 h, 14C-glucose and 10-8 M insulin was added for another 24 h. The incorporation of 14C-glucose into cellular lipids was measured. Results are presented as percentage of insulin-stimulated control and the mean + SEM of one triplicate experiment per patient.
Figure S3 Figure S3: TRAIL does not affect basal glucose uptake and de novo lipogenesis in human fat cells SGBS adipocytes were treated with increasing doses of TRAIL for 24 h. (A) The cellular uptake of 14C-deoxy-glucose uptake was measured on a b-counter. Data are presented as counts per minute (cpm) and the mean + SEM of four independent, triplicate experiments. (B) SGBS adipocytes were treated with increasing doses of TRAIL. After 24 h, 14C-glucose was added for another 24 h. The incorporation of 14C-glucose into cellular lipids was measured. Results are presented as counts per minute (cpm) and the mean + SEM of three independent, triplicate experiments.
Figure S4 FASN ACC 1.2 Glut-4 1.0 * 0.8 * 0.6 relative mRNA-expression 0.4 0.2 0.0 0 1 10 100 TRAIL (ng/ml) Figure S4: TRAIL downregulates the mRNA expression of lipogenic genes SGBS adipocytes were incubated with vehicle or indicated concentrations of TRAIL. After 24 h total RNA was prepared and reversely transcribed. qPCR was performed using specific primers for glucose transporter-4 (Glut-4), acetyl-carboxyl-carboxylase (ACC), and fatty acid synthase (FASN). Results are standardized to GAPDH and related to vehicle control. Data are presented as mean + SEM of five independent experiments. * p< 0.05 (TRAIL vs. vehicle control).
Figure S5 Figure S5: Effect of TRAIL on basal and insulin stimulated phosphorylation of mitogen-activated protein kinases and other serin/threonin kinases Adipocytes were incubated with 100 ng/ml TRAIL or vehicle (control) for 24 h followed by 15 min incubation in the absence or presence of insulin (10 nM). Cells were lysed and phosphorylation of mitogen-activated protein kinases (MAPKs) and other serine/threonine kinases was studied using the Human Phospho-MAPK Array Kit (R&D Systems Inc, Minneapolis, USA) according to manufacturer’s manual. Detection was done by enhanced chemo-luminescence (Amersham Bioscience, Freiburg, Germany). Quantification was done with ImageJ software.
Figure S6 70 * * 60 * 50 specific apoptosis (%) 40 30 20 10 0 TRAIL CHX 1 - 10 - 100 - - + 1 + 10 + 100 + Figure S6: SGBS adipocytes are resistant to TRAIL-induced apoptosis. SGBS adipocytes were incubated with 1, 10, and 100 ng/ml TRAIL in the absence or presence of 10 µg/ml cyclohexmide. After 72 h, cells were harvested and apoptosis was quantified by measuring the content of hypodiploid DNA on a flow cytometer according to Nicoletti et al. (J Immunol Methods, 1991). The percentage of specific apoptosis was calculated as follows: 100 x [experimental apoptosis (%) – spontaneous apoptosis in medium (%)] / [100% – spontaneous apoptosis in medium (%)]. Data are expressed as mean + SEM of three independent triplicate experiments.* p< 0.05 TRAIL vs TRAIL + CHX.
Table S1 Table S1: Putative caspase cleavage sites in FASN protein Potential cleavage sites for caspase-1, -3, -6 and -8 in the amino acid sequence of fatty acid synthase (FASN) as identified by the web-based program GraBCas (http://www.uniklinikum‑saarland.de/einrichtungen/fachrichtungen/human genetik/software/) Bold: cleavage sites that would result in a protein fragment of detected size (96-116 kDa).