Download
1 / 29
290 likes | 474 Views
Introduction to Water Quality Monitoring and QAQC. Kristy Morris, PhD kristy@watershedhealth.org. Your Watershed: San Gabriel River. upper watershed (504 stream miles) . lower watershed (715 stream miles). mainstem channel ( 17 stream miles). Estuary. Watershed Description.

E N D
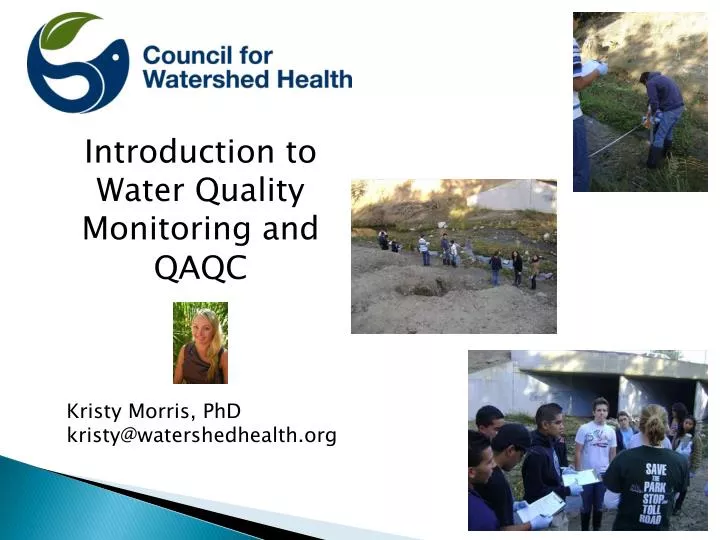
Introduction to Water Quality Monitoring and QAQC Kristy Morris, PhD kristy@watershedhealth.org
Your Watershed: San Gabriel River • upper watershed (504 stream miles) • lower watershed (715 stream miles) • mainstem channel • (17 stream miles) • Estuary
Watershed Description • 689 square miles • ~2.3 million people • 47% undeveloped; all in the upper watershed
Unique Habitats Santa Fe Dam Scrub Habitat Los Cerritos Wetland Whittier Narrows Walnut Creek County Park
San Gabriel River Regional Monitoring Program Monitoring Questions Watershed Condition.
What is the health of streams ? • Bioassessment Condition? • 7-day Ceriodaphnia test • Surveys: SWAMP and CADF&G • California Rapid Assessment Method (CRAM)
Chemical and Physical Parameters we will measure: • Temperature • Dissolved Oxygen • Nitrates and Phosphates • pH • Turbidity • Flow (qualitative)
Data Quality • High Quality data correctly represent the real-world concept to which they refer • High Quality Data that are acceptable for their intended uses • e.g decision making, planning.
Elements of a QAPP The QAPP lists all acceptable procedures to be performed: • Where to collect a sample • When to collect a sample • How to collect a sample • How to store or analyze a sample • Minimum acceptable QA/QC • Minimum acceptable results and allowable reportable results
How to analyze a sample Types of methods: Selection of method depends on: • Skills and Expertise of the analyst • Time and Budget • Number of Samples • Program Quality Assurance/ Quality Control Requirements • “use best available” electrochemical gravimetric volumetric spectroscopic colorimetric
Quality Assurance/ Quality Control(QA/QC) • Accuracy • How close the measurement is to its true value • Field: Calibrate Field Instruments • Lab: Quality Control Standards (QCs) • Precision • How well repeated measurements agree • Lab and Field: Duplicate samples
Quality Assurance/ Quality Control(QA/QC) • Representativeness • extent to which measurements actually represent the true environmental condition at the time a sample was collected • Completeness • comparison between the amount of data intended to be collected vs. actual amount of valid (usable) data collected • Comparability • extent to which data can be compared between sample locations or periods of time within a project, or between projects
QA/QC Considerations of the data • Is the value reasonable? • pH= 16?? • Validate the data • Check for accuracy, precision, completeness etc. • Check your units • ug/L vs mg/L • mg/L or ppm ???? • Parts per million - ppm - is commonly used as a measure of small levels of pollutants in water • Parts per million is the ratio between the pollutant component (mg) and the solution (L) = mg/L
Contact • Kristy Morris, PhDSr Water Quality SpecialistCouncil for Watershed Health700 N. Alameda St.Los Angeles, CA 90012www.watershedhealth.orgPh: 213.229.9960Fax: 213.229.9952
Temperature UNCE, Reno, NV
Why do we care about temperature? • Fish and other aquatic life • Other effects…. • How much oxygen water can absorb • The toxicity of ammonia
What causes temperatures to rise? Natural causes: Seasons Length of river Location of river Hot springs Human causes: Removal of streamside vegetation (shade) Runoff over concrete and other heated surfaces Changes in stream shape Reductions in flow Impoundments Industrial discharges
Dissolved Oxygen UNCE, Reno, NV
Why do we care about dissolved oxygen (DO)? • Fish and other aquatic life • Other effects… • Oxygen in water affects solubility of metals and other chemicals
What causes oxygen concentrations to change? Natural causes: Uptake by organisms Natural increases in temperature Quiet water (low re-oxygenation) Human causes: Any source of biological material that will decay in water High temperatures or low flows Excessive plant growth in water
Nitrates UNCE, Reno, NV
What causes nitrogen concentrations to change? • Natural causes: • Seasonal changes • Plant uptake • Human causes: • Land uses in the watershed • Fertilizers, animal manure • Malfunctioning septic systems • Discharges from sewage facilities and acid • precipitation
pH UNCE, Reno, NV
pH = the level of acidity or alkalinity in a solution pH Scale: Pure Hydrochloric Acid Baking Soda Pure Sodium Hydroxide Vinegar, Wine, Orange Juice Bleach Milk Rain Water 5.6 Sea Water Gastric Fluids Lemon Juice Household Ammonia Oven Cleaner
Why do we care about pH? • Low pH can affect membranes • (eg. gills of fish or macroinvertebrates and eggs) • At low pH, causes some metals to dissolve into a more toxic form • At high pH, ammonia is more toxic
What causes pH to rise or fall? Natural causes: Rain is naturally acidic Rapid snow melt Photosynthesis in water higher pH Human causes: Combustion causes acids in the atmosphere acid precipitation Industrial discharge Mine drainage
(Turbidity) USDA NRCS
Why do we care about sediments in streams and lakes? • Can fill space between cobble in stream and smother fish eggs and tiny aquatic life • Very cloudy water affects visual predators • Sediments fill in reservoirs • Sediments bring nutrients, metals, and more into water
What are sources of sediment in rivers? Natural causes: Natural “reworking” of flood plain as stream meanders Remobilized bedload sediment under high flows Seasonal effects Human causes: runoff (construction, agriculture, forestry, mining) stream banks erosion