Download
1 / 43
430 likes | 534 Views
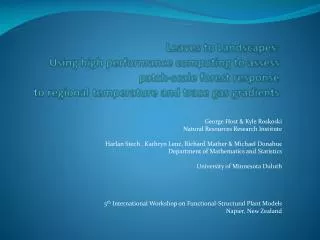
Potential Native Plant Communities for the Drift and Lake Plains, Western and Southern Superior Uplands. George Host and Terry Brown Natural Resources Research Institute University of Minnesota Duluth Sept 27, 2012. Motivating issues.

E N D
Potential Native Plant Communities for the Drift and Lake Plains, Western and Southern Superior Uplands George Host and Terry Brown Natural Resources Research Institute University of Minnesota Duluth Sept 27, 2012
Motivating issues • There have been many efforts over several decades to develop ecologically based vegetation classifications in Minnesota • Habitat Types (Kotar & Kerhohan) • Biophysical Land Units (Prettyman) • Landscape Ecosystems (Frelich, White, Brown, Host, others) • Native Plant Communities (Almendinger, Hansen, others) • All have similar intents, differ in methods, mapping resolution and classification resolution • Necessary information for cross-ownership land use planning and decision-making
Chippewa National Forest ECSShadis and AlmendingerLate 1980 – early 1990s • Ecological Landtype Phase (ELTP mapping) • Classification system based on relevee data • Ground flora indicators + soils • Acre-by-acre field mapping • “adaptive classification” - questions raised in mapping processes helped define classification scheme
Aitkin Co. – Forest Ecological Systems 2000-2001 • Inputs • SSURGO-level soil • soil series • moisture and nutrient fields • GLO bearing trees, Marschner map • LTAs • Classes (FES) – dominant cover x soil moisture • Outputs • Distribution of types by ownership • Patch stats, large patch analysis, buffer analysis
Carlton Co. – Forest Ecological Systems 2002-2003 • Inputs • SSURGO • GLO Bearing trees – interpolated individual species • Classes – pre field guide NPC types • Outputs • Distribution of types by ownership
Hubbard and Cass Counties 2001-2002 • Inputs • SSURGO-level soil – moisture and nutrient fields • Bearing trees summarized by SSURGO units • Bearing tree distance • LTAs • Classes – pre Field Guide (Almendinger-Hansen ECS) • Outputs • Distribution of types by ownership • Assess county land holdings • Silvicultural strategies • Landscape goals (dispersed recreation, large patch management
Koochiching Co. – Native Plant Communities2006-2008 Tamarack • Inputs • SSURGO not available • Cummins-Grigal soils map • STATSGO • Terrain analysis via Digital Elevation Models (slope, aspect, SD elevation, Topographic Moisture Index) • NWI (separate analysis for uplands & wetlands) • Bearing trees density maps • Subsections and LTAs • Analysis • Data gridded to 30 m pixels • Isodata cluster analysis 16 uplands & wetland classes • Summarize bearing trees within clusters – NPC indicators • NPC Classes Cedar
Northern Superior Upland Landscape Ecosystems Step 1 – use climate, soil, physiography to identify landscape units White and Host 2000
Northern Superior Upland Landscape Ecosystems Step 2 – intersect landscape units with forest inventory data from late successional stands White and Host 2000
Current effort • Spatial resolution of the Drift and Lake Plains is low (e.g. broad land units) compared to the Northern Superior Uplands and other systems. • No single NPC Class map available across the Province 212 (Laurentian Mixed Forest)
Current Effort • Drift and Lake Plains • Southern Superior Uplands • Western Superior Uplands • Area facts • 26 Counties • ~12,000,000 acres • 18,750 sq mi
Modeling Strategy • Summarize factors controlling distribution of NPCs • Climate • Geomorphology • Soils
Climate • # Frost-free days • Minimum temperature • Maximum temperature • Potential Evapotranspiration
Geomorphology • Geomorphic association • Subsection • Landtype Association • Clustered based on similarity • Elevation • Topographic Moisture Index • Slope • Aspect
Soils (SSURGO) • Soil Texture (40 and 8 classes) • Drainage class • Soil K-Factor • Cation Exchange Capacity
Releve Data • MN DNR Releve surveys • List of understory plants • Forest overstory • Soil profile info • Site description
GIS Analysis • Study area gridded to 30 m pixels • 3 x 3 moving window to summarize spatial data layers • Run across all 3 subsections • Intersect each releve point with the gridded spatial data • Describes the climate, landform, soils for each releve
Gridded map layer This creates the input data for classification
Classification technique • Recursive partitioning (RPART) • Developed for data mining • Handles both categorical and continuous data • Produces a classification “Tree”
NPC System-levelClassification Tree Available Water Capacity Presettlement Type 12 = Jack Pine Drainage Class 1-2 Gravelly sand to loamy fine sand
Silvicultural Applications http://www.dnr.state.mn.us/forestry/ecs_silv/interpretations.html
…likely success of natural regeneration with little silvicultural manipulation
Applications: Economic • Class level NPCs vary in successional patterns mean annual biomass increment Host, G. E., K.S. Pregitzer, C.W. Ramm, D.P. Lusch, and D.T. Cleland. 1988. Variation in overstory biomass among glacial landforms and ecological land units in northwestern Lower Michigan. Canadian Journal of Forest Research 18:659-668. Host, G. E. and J. Pastor. 1998. Modeling forest succession among ecological land units in northern Minnesota.Conservation Ecology, 2(2): 15. www.consecol.org/vol2/iss2/art15.
Applications: Social • What are the risks involved in populating historically fire-dependent ecosystems? • What are the risks of not harvesting overmature or late successional stands in settled areas? • Does fire risk change in highly fragmented landscapes? • How will risk change in a changing climate?
Conclusions • Now have wall-to-wall high resolution maps for the Laurentian Mixed Forest Province • Maps are keyed to MN DNR Classification at system and class levels • Provide a basis for ecological, social and economic analyses
Acknowledgements • Funded by • MN DNR, MFRC • USDA Forest Service • Blandin Foundation • St. Louis County • Crow Wing County • In-kind support from MN DNR • Thanks to Peter Reich, the Boreal Forest and Community Resilience Project and CFANS for grant administration
Talking Points • How to move forward? • What is the appropriate classification? • What is the appropriate classification resolution? • System (6 forested)? Class (~30+)? Aggregated classes? • How do we crosswalk with cover types and model outputs?