Download
1 / 40
400 likes | 718 Views
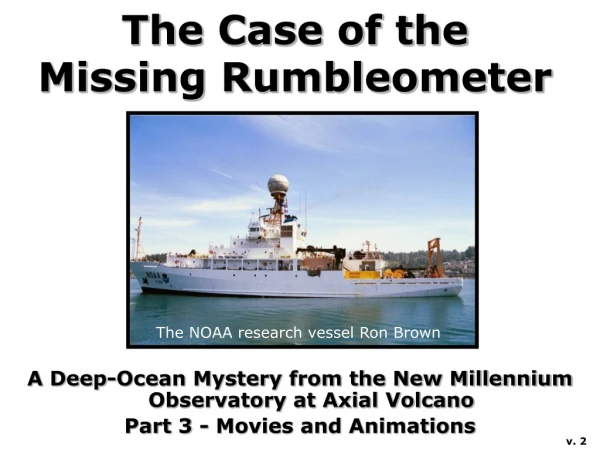
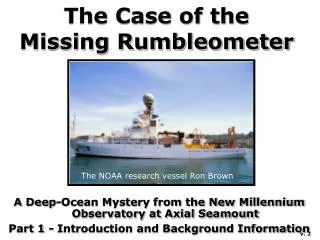
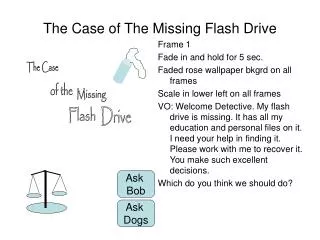
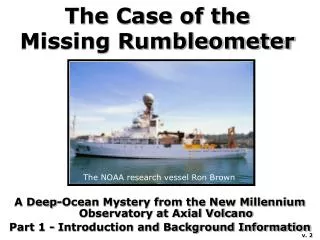
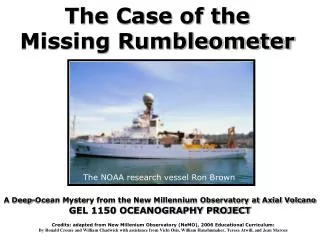
The Case of the Missing Rumbleometer. A Deep-Ocean Mystery from the New Millennium Observatory at Axial Volcano Part 4 - Key for Teachers. The NOAA research vessel Ron Brown. v. 2b. A Mystery to Solve.

E N D
The Case of the Missing Rumbleometer A Deep-Ocean Mystery from the New Millennium Observatory at Axial Volcano Part 4 - Key for Teachers The NOAA research vessel Ron Brown v. 2b
A Mystery to Solve Oblique view of the seafloor around Axial Volcano (white area near the center). In this computer generated image blue areas are deep and white are shallow. Several months ago, thousands of small earthquakes were detected at Axial Seamount, an active submarine volcano. This may mean that an eruption has occurred, but not necessarily. Your mission is to go to Axial Volcano and find out what happened there.
The Missing Rumbleometer Fortunately, a seafloor monitoring instrument, called a “rumbleometer” was already at Axial Volcano during the earthquakes and will provide important clues. But another ship was just out at the site and was not able to recover the rumbleometer. They could communicate with it on the bottom, so they know it is still on the seafloor, but they could not make it release and return to the surface. Why didn’t it return? Is it stuck on the bottom somehow? We really want to get the rumbleometer back because it likely recorded information on what the volcano was doing and will help us understand what happened during the earthquakes. We know where the rumbleometer is on the bottom, but you need to go out to Axial and find out why the rumbleometer did not come up. Then you need to recover it and look at the data it recorded to figure out what happened at Axial during the earthquakes. A research ship with a remotely operated vehicle are standing by ...
Glossary Acoustic: Pertaining to sound. Bathymetric map: A chart of ocean floor depths, similar to topographic maps on land. Caldera: A depression formed at the summit of a volcano caused by collapse when magma is removed from below. Chemosynthesis: The process by which microbes mediate chemical reactions to produce energy. This is in contrast to photosynthesis, because chemosynthesis does not require sunlight. Contour profile: A cross-section of topography along a given line. Degree: A unit of angular distance. There are 360 degrees in a circle (as on a compass). Deposit feeder: Animals that consume small pieces of plant and animal material that settle to the ocean floor from the water column. Epicenter: The point on the Earth's surface from which earthquake waves seem to radiate, located directly above the true center of the earthquake at depth. Earthquake swarm: A sequence of many small earthquakes (10’s to 1000’s), all of similar size (less than magnitude 4) and within a relatively short period of time (hours to weeks). Earthquake swarms are often recorded during volcanic activity. Hydrophone: An instrument used to record sound under water. Hydrothermal vent: A hot spring on the seafloor. Latitude: Angular distance on the Earth’s surface measured north or south of the equator. Lava: Molten rock after it has erupted from a volcano onto the Earth’s surface. Longitude: Angular distance on the surface of the Earth measured east or west from the prime meridian at Greenwich, England.
Magma: Molten rock that is underground, before it has erupted onto the Earth’s surface. Microbes: Single-celled living organisms, such as bacteria and archaea. Mid-ocean ridge: A type of tectonic plate boundary where two tectonic plates are moving apart (also called a “spreading center”). Volcanic activity creates a ridge along the boundary. Minute of latitude or longitude: A unit of angular distance that is 1/60 of a degree. Observatory: A site for long-term scientific observations. ROPOS: The name of the remotely operated vehicle usually used at NeMO. ROPOS stands for “Remotely Operated Platform for Ocean Science”. Rumbleometer: (pronounced rum-ble-om’-i-ter) A seafloor instrument that measures temperature and pressure (among other things) to help monitor submarine volcanoes. Seamount: An undersea mountain rising over 1000 meters above the surrounding seafloor. Seismometer: An instrument that detects ground movement from earthquakes. Sessile: Refers to marine animals that are permanently attached at the base; fixed in one place and unable to move around. Spreading center: See Mid-ocean ridge Subduction zone: A type of tectonic plate boundary where two tectonic plates are converging (moving toward each other) and one plate is forced under the other. Sulfide chimney: Formations made of sulfide minerals deposited directly from hydrothermal vent fluid at high-temperature seafloor hot springs. Symbiotic: The relationship of different organisms in a close association that is mutually beneficial. Many vent animals have symbiotic relationships with chemosynthetic microbes. Tectonic plates: Large intact pieces of the Earth’s outer rocky layer that move in relation to one another. Most of the Earth’s earthquakes and volcanoes are located near tectonic plate boundaries. Transform fault: A type of tectonic plate boundary where one plate slides past another. Triangulation: Method of finding a position with distances or angles from known points.
The NeMO Curriculum The NeMO curriculum is based on real events and real data: the 1998 eruption at Axial Volcano and the rumbleometer instrument that was stuck in the new lava flow. The activities for the classroom are modeled on how scientists actually investigated this event. This curriculum is intended for middle and high school students in earth science and marine science classes. It is composed of four parts (which are each a separate file): Part 1 – Introduction and Background Information Part 2 – Classroom Activities Part 3 – Movies and Animations Part 4 – Key for Teachers (this file) This fourth part of the NeMO curriculum includes the answers to questions posed in the Classroom Activities section (Part 2). It also contains advice for presenting the curriculum and additional background information that could be incorporated into the lessons. The NeMO curriculum is available in Powerpoint, PDF, or HTML file formats at: http://www.pmel.noaa.gov/vents/nemo/education.html
Part 1 - Introduction and Background Information Part 1 of the NeMO Curriculum gives some general background information about plate tectonics, mid-ocean ridges, hydrothermal vents, and the animals that live near them. It also gives some information on Axial Volcano and the rumbleometer instrument. Movies #1 and #2 in Part 3 of the NeMO Curriculum would be good to show while students are going over the material in Part 1. Movie #1 shows an active black smoker chimney. Movie #2 shows a close-up of tubeworms living at a hydrothermal vent. The rest of Part 4 (this file) will concentrate on the Classroom Activities in Part 2 of the NeMO Curriculum.
Part 2 of the NeMO Curriculum includes activities based on how scientists study active volcanoes on the deep ocean floor. Each activity also gives clues to help students figure out what happened to the missing rumbleometer. The four activities are: 1) Using triangulation to locate an earthquake epicenter, so the students know where to take the ship. 2) Looking for clues as to why the rumbleometer is stuck, by making an ocean floor traverse with a remotely operated vehicle. 3) Creating cross-section profiles of the seafloor to determine where there have been depth changes due to an eruption. 4) Graphing data from the rumbleometer instrument and using it to figure out what happened at the volcano and when. Students should follow the curriculum step by step and not jump ahead, because each activity builds on the one before. Part 2 - Information for teachers about the Classroom Activities
Activity #1Locating an Earthquake Epicenter If your triangulation was performed correctly, you will have located the epicenter at the approximate coordinates of: 45˚ 55.8’ / -129˚ 59.1’ This happens to be right near the rumbleometer. AX03 EPICENTER Epicenter AX01 AX02
Activity #1: Supplemental information: Working with latitude and longitude A correct understanding of how to work with latitude and longitude coordinates is essential to the students’ successful completion of this activity (and the next 2 activities). Both latitude and longitude are angular measures of distance on the Earth’s surface and are used to specify locations on the globe. The units of latitude and longitude are degrees (°) and minutes (’), for example: 45° 10.0’ is 45 degrees and 10.0 minutes. Each degree of latitude and longitude is made up of 60 minutes, and each minute can be divided into tenths. On a map, latitude is the north-south axis and longitude is the east-west axis. Note that in the western hemisphere, degrees of longitude are negative and become increasingly negative from right-to-left. Since most students are used to positive numbers increasing from left-to-right on an x-axis, this is potentially confusing. A note about distance units: 1 minute of latitude = 1 nautical mile = 1.85 kilometers 1 meter = 3.28 feet
Activity #1: Supplemental information: Locating earthquake epicenters on land vs. in the ocean Note that the methods scientists use to locate earthquakes on land and in the ocean are somewhat different. • On land, seismometers are used to measure the shaking of the ground from nearby earthquakes, but small earthquakes in the oceans are usually too far away to be detected. • In the ocean, hydrophones are used instead to detect the faint rumbling sounds from oceanic earthquakes. Hydrophones are better for detecting oceanic earthquakes because sound waves (T-waves) travel much more efficiently in water than P- or S- waves do in the solid earth. • In addition, the difference in travel time between P- and S- waves can give the distance to an earthquake epicenter on land. In the ocean, however, only the acoustic T-wave is recorded so the travel time and earthquake epicenter must be calculated in a more complicated fashion from many observations. Hydrophone arrays can also give the direction to the epicenter, but cannot give any depth information.
Activity #2Ocean Floor Traverse The main goal of this activity is to look at the area near the rumbleometer for clues. Students should determine if the lava they see is old or new at each of 8 sites they visit, based on clues from the geology and biology. Was there an eruption, and if so where? It turns out the missing rumbleometer is sitting in the middle of a new lava flow! Each of the eight sites are described on the following pages.
Site #1: 45˚ 55.8’ / -129˚ 58.7’ This is your first stop with ROPOS. The lava appears somewhat sedimented, indicating that it is probably not new. The crabs and octopus are mobile and do not give any information on lava age. The key information on lava age is from the sessile sponges and seafans, because they take years to become established (they are only found on old lava). The brittle star and sea cucumber are deposit feeders and generally do not inhabit vent areas. • Old lava, uncollapsed • No hydrothermal vent • Old non-vent biological community
Site #2: 45˚ 55.8’ / -129˚ 58.8’ This 5-meter high chimney must have taken many years to grow this large from sulfide minerals precipitated out of the hot vent fluid. There is no indication of any new lava and the animal community at the base of the chimney appears to be many years old and well-established, because the tubeworms are large and there are many different vent species are present. • Old lava, uncollapsed • Old hydrothermal vent • Old vent biological community
Site #3: 45˚ 55.8’ / -129˚ 58.9’ The lava at this site is completely barren (uncolonized), except where there is venting, evidence that this is probably new lava. White microbial mat growth is evidence of warm water venting and numerous scaleworms are found grazing on it. The fact that few other vent species are present and that the tubeworms are small and white indicates that the hydrothermal vent is very young and is on new lava. • New lava, uncollapsed • New hydrothermal vent • New colony of vent animals
Site #4: 45˚ 55.8’ / -129˚ 58.95’ The lava appears relatively young here. The rattail fish is mobile and does not tell us anything about lava age. The key observation for lava age is that there are no sessile animals observed anywhere, which take a long time to colonize and would indicate old lava. This is new lava. This is an area of collapse suggesting you are near the center of the new lava flow. Lava pillars are holding up the original upper crust of the lava flow in some places at the edge of the collapse. • New lava, collapsed • No biological communities, no hydrothermal vent
Site #5: 45˚ 55.8’ / -129˚ 59.05’ Here’s the missing rumbleometer and it appears that it is trapped in the new lava flow (this is why it is stuck on the bottom and couldn’t return to the surface on its own earlier). Its three legs are buried in the new lava and it is lying in the bottom of a collapse area. Compare these pictures of the instrument with the one on page 18 of Part 2 (which shows the legs). Portions of the plastic yellow protective covers on the floats have been slightly melted by the lava. Speculate as to why the rumbleometer didn’t become totally buried in lava if it is in the bottom of the 3-meter deep collapse area. (More on this later...) This might be a good time to show Movies #3 and #4 in Part 3 of the NeMO Curriculum. • New lava, collapsed • No biological communities, no hydrothermal vent
Site #6: 45˚ 55.8’ / -129˚ 59.1’ You are now back out of the collapsed area and are getting close to the other edge of the new lava flow. Again, the key observation for lava age is that the lava is barren (no sessile animals) except where there is an isolated hydrothermal vent. The low number of species (only snails and limpets) indicates the vent is very young and only recently colonized. • New lava, uncollapsed • New colony of vent animals
Site #7: 45˚ 55.8’ / -129˚ 59.2’ Now we are back into older lava (on the far side of the new lava flow). There does not appear to be a hydrothermal vent nearby. Instead, you see a variety of sponges, soft corals, brittle stars, and fish. The sessile animals indicate that the lava at this site has been colonized for many years and is old. • Old lava, uncollapsed, no hydrothermal vent • Old, established non-vent biological community
Site #8: 45˚ 55.8’ / -129˚ 59.3’ At this site you find evidence of a hydrothermal vent that has been active for a long time. There is a large, well established colony of vent animals consisting of a very diverse mix of species. The tubeworms are large and brown and have been growing here for years. This is old lava. • Old lava, uncollapsed, old hydrothermal vent • Old, established vent biological community Bottom line: The ocean floor traverse showed that there is new lava at sites #3-6 (there WAS an eruption!) and that the rumbleometer is located in the middle of new lava flow! That is why it is stuck on the bottom! Also, we noticed that it is in the bottom of a deep collapse area, where it seems that it should have been buried by the lava. (We’ll learn why not later…)
Activity #3Contour Profiles This activity shows where the new lava flow is in the map area and how it changed the seafloor. Five completed contour profiles are included in the following pages. It is recommended that students be divided into five teams, each completing one contour profile at each minute of latitude on the left side of the PRE- and POST- event maps (from 45˚ 55.6’ to 45˚ 56.0’). Note that the upper surface of the new lava flow was probably nearly horizontal before it drained out and collapsed (shown by the dashed lines in the profiles). Thus, the area of collapse on each profile is the portion in the middle of the flow that is trough-like. For example, in the first profile, the new lava flow is up to 7 meters thick and the area of collapse is about 3 meters deep.
Rumbleometer Notice that the rumbleometer is in the floor of a collapsed area. It did not get buried by lava even though the flow was three meters higher before it collapsed (dashed line). The reason why is because it became embedded in the lava flow’s upper crust and was uplifted as the flow inflated and thickened, then was set down again when the lava drained out. This sequence of events is shown by the pressure data recorded by the instrument (and graphed by the students in Classroom Activity #4). It is also shown in Movie #5 in Part 3 of the NeMO Curriculum.
Activity #4Graphing temperature and depth data from the rumbleometer The Rumbleometer recorded both temperature and pressure. The pressure data can be converted to an equivalent depth and so shows if the instrument moved up or down during the eruption. The students are asked to graph some of the rumbleometer data and try to interpret it. On the following two pages, you will find completed temperature and depth graphs. According to the pressure data, the eruption started at 15.4 hours and stopped at 17.5 hours. Therefore, the eruption lasted for only 2.1 hours (very short)! The temperature remained elevated for longer as the new lava flow slowly cooled.
Rumbleometer Temperature Data The rescued rumbleometer was in remarkably good condition. Only the yellow plastic “hard-hats” that protect the glass ball flotation were melted in a few spots where they had come in contact with the lava. Even though the lava was erupted at a temperature of about 1200°C (~2200°F), the instrument was kept relatively cool because it was bathed in frigid seawater (~2°C) which dissipated most of that heat. Also, the lava quickly forms a solid crust over its molten surface, which greatly insulates the heat below. The temperature sensor on board the rumbleometer only recorded a 4°C increase in temperature during the eruption! Amazing!
Rumbleometer Pressure Data The data from the rumbleometer that reveals the most about the eruption is from the pressure sensor, which recorded vertical movements (changes in depth) of the instrument. The pressure data show that the lava flow must have first spread out as a thin sheet under the instrument.Then the lava flow began to thicken or inflate upward with a solid crust over a molten interior. During this inflation stage, the rumbleometer was actually lifted upward three meters by the solid upper crust.Soon, thereafter, the eruption began to wane and lava drained back into the eruptive vent, and the rumbleometer was lowered back down, ending up about half a meter higher than it started. Perhaps most remarkably, all this took place in the span of only two hours. This is the first time that a submarine eruption has actually been caught in the act, all because an instrument was in the right place at the right time, and managed to survive! This data explains why the instrument was not buried by lava. The lava flowed underneath, lifted it up, and then set it back down again. During Classroom Activity #4 would be a great time to play Movie #5 from Part 3 of the NeMO Curriculum. This movie shows the sequence of events described above.
In reality, the instrument was first found on the bottom in August 1998, the summer following the eruption. ROPOS could not even budge the instrument with its manipulator arm, which can exert ~500 pounds of force. Next, a line was attached and the instrument was pulled upward with ~2000 pounds of force, but even this was not enough to free the instrument. The following summer ROPOS returned to Axial Volcano with a specially designed harness that could deliver ~10,000 pounds of force. How the rumbleometer was rescued The rumbleometer after it was freed from the lava flow. It is floating above the bottom but still attached to an anchor line. Once the anchor line was cut it floated up to the surface and was recovered.
A cable was attached to one corner of the rumbleometer’s base at the one exposed leg. With a strong pull from the ship at the surface the instrument was finally pulled free from the lava, and floated its way to freedom. The data the rumbleometer recorded is the first glimpse from “ground zero” during a submarine volcanic eruption. The successful rescue The rumbleometer on deck after being rescued. During Classroom Activity #4 would be a great time to play Movie #6 from Part 3 of the NeMO Curriculum. This movie shows the rumbleometer rescue operation.
High-resolution bathymetric map of the rumbleometer site This is real bathymetry collected by ROPOS over the area we have studied (after the 1998 eruption). Warm colors are shallower and cool colors are deeper. The solid red line indicates the edge of the 1998 lava flow. The red dot is the rumbleometer’s location. A full screen view follows.
Links to related information 1) http://www.pmel.noaa.gov/vents/nemo/ The home page for the New Millennium Observatory. 2) http://www.pmel.noaa.gov/vents/nemo/explorer.html The NeMO Explorer site, specializing in visualizations of the seafloor at NeMO 3) http://www.pmel.noaa.gov/vents/nemo/explorer/concept.html An explanation of various concepts related to NeMO, from seafloor spreading to lava flow morphology 4) http://www.pmel.noaa.gov/vents/ The main web page for the NOAA Vents Program 5) http://www.pmel.noaa.gov/vents/geology/video.html This web page has video clips from NeMO and other research areas of the NOAA Vents Program. 6) http://www.pmel.noaa.gov/vents/geology/submarine_eruptions.html A summary of historical submarine volcanic eruptions in the NE Pacific. 7) http://www.pmel.noaa.gov/vents/nemo/links.html A listing of links to related web sites featuring oceanographic research 8) http://www.ropos.com/ The ROPOS web page.
Education Benchmarks This curriculum is designed to meet the following specific benchmarks for science education, as adopted by the Oregon Department of Education. • Identify and describe the factors that influence or change the balance of populations in their environment. • Explain the structure of the Earth. • Analyze evidence of ongoing evolution of the Earth system. • Ask questions or form hypotheses that are based on observations and scientific concepts that can be tested through scientific investigations. • Collect and organize sufficient data by using methods and procedures that support analysis. • Analyze data and evaluate sources of error or bias. • Propose explanations that are supported by data and knowledge of science concepts and principles.
Thank you for using the NeMO Curriculum We would be interested in any feedback you have about this curriculum. Please send comments or suggestions for improvements to: nemo.webmaster@noaa.gov Please mention you have version 2.0b (December 2003)
This is Part 4 of 4 of the NeMO Curriculum, which is available at http://www.pmel.noaa.gov/vents/nemo/education.html The NeMO Curriculum was funded byThe National Science Foundation Geoscience Education Program With additional support from the NOAA Vents Program and Oregon SeaGrant Written by Ronald Crouse and William Chadwick with assistance from Vicki Osis, William Hanshumaker, Teresa Atwill, and Jean Marcus