Download
1 / 9
90 likes | 1.04k Views
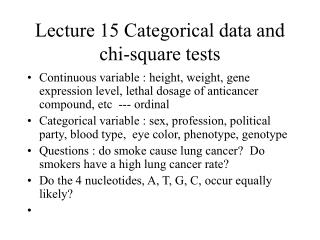
Categorical and discrete data. Non-parametric tests. Non-parametric tests: estimate sample differences when the known distribution shapes cannot help, or even confuse. Metrics of arbitrary distibutions. Median: the value that "splits the sample in half"

E N D
Non-parametric tests: estimate sample differences when the known distribution shapes cannot help, or even confuse
Metrics of arbitrary distibutions • Median: the value that "splits the sample in half" • Mode: the value that occurs with the greatest frequency. • n-th procentile: the value between n% of the sorted sample and the rest of it. Hence quantiles, quartiles, deciles etc.
Non-parametric correlations Spearman R: The closest analog of Pearson r with the difference that, instead of each raw value, its rank in the sample is used X – Y X – Z 2.4 -> 5 3.2 -> 1 2.7 -> 4 2.3 -> 6 2.2 -> 7 3.1 -> 2 2.0 -> 8 2.9 -> 3 5 – 6 1 – 1 4 – 3 6 – 5 7 – 8 2 – 2 8 – 7 3 – 4 5 – 8 1 – 6 4 – 3 6 – 2 7 – 4 2 – 5 8 – 1 3 – 7
Non-parametric correlations Spearman R: A variability ratio (X and Y vary synchronously) / (X and Y vary in total) Kendall Tau: A probability ratio P(X and Y are related) / P(X and Y are NOT related)
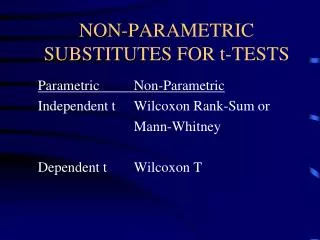
Comparing two independent samples The Mann-Whitney U test: The closest analog of the t-test with the difference that, instead of each raw value, its rank in the sample is used Wald-Wolfowitz runs test: Estimates if two samples differ in BOTH means and distribution shapes – – + – – – – – – – + – + + + – + + – + + + + – + + – – + – + – + + – – + + – + – + + + – + + – + + ––
Comparing two dependent samples Sign test: Wilcoxon matched pairs test: The difference between two tied samples is significant, if a sum of pairwise differences (either positive or negative ones) is TOO BIG > > < < > < < > < < > < < < < >
2 x 2 tables Chi-square test, Fisher’s exact test: Χ2 =Σ(Observed - Expected)2 / Expected
Nonparametric methods are most appropriate when the sample sizes are small. When the data set is large (e.g., n > 100) it often makes little sense to use nonparametric statistics at all: When the samples become very large, then the sample means will follow the normal distribution even if the respective variable is not normally distributed in the population