Download
1 / 18
180 likes | 428 Views
West Philadelphia and South Philadelphia Housing Correlations. Tom DiMarco CIS 61 – Programming in Matlab June 27, 2006. Where did was the data from?. University of Pennsylvania Databank on West Philadelphia and Pilot Project for South Philadelphia. Excel format files (.xls).

E N D
West Philadelphia andSouth Philadelphia Housing Correlations Tom DiMarco CIS 61 – Programming in Matlab June 27, 2006
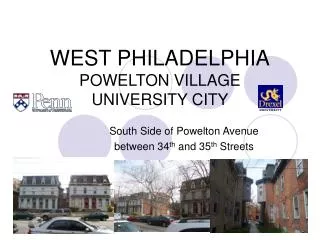
Where did was the data from? • University of Pennsylvania Databank on West Philadelphia and Pilot Project for South Philadelphia. • Excel format files (.xls). • Grouped by Census Tracts - Grouping Census Uses. • Show Geographic Areas of West and SW Philadelphia on Internet at site http://westphillydata.library.upenn.edu/
How did I analyze the data? • Used Excel – Data Analysis Tool • Used Matlab – originally with my own function I found from a book which defines R^2 as: (βX’Y – SUM(Y)^2/n)/(Y’Y-SUM(Y)^2) • Used the regress function which gave back R^2, p-value, F-statistic, and standard error (mse). • Used Yilian’s function for learning and predicting for mse.
What method did the Matlab Program to use? • Had some read functions to read in housing data. Took name of Housing File to Read from. • Had function generateFeatureComparison – which was a main function that took the Housing Data, Housing Zeros Vector, name of Excel file then returning R^2. • In this function was a call to read the feature data, get the zeros, union the zeros of this feature and housing zeros to get two matrices which where the matrices to compare without the zero data. Then called linearRegression which was my own function built on the formula enumerated. Then called regress to compare how the regression worked and got a p-value.
What was special about the program? • It made a 150 samples with replacement similar to what we did in lab. • It had Data Normalization. To make the data more centralized and generate more apparent correlations?
What was used for Data Normalization? • Three methods where used: • Digital Scaling which uses the formula: y = x./10^k where k is the max(abs(y)) this produces values between [0,1] • Data Min Maxing which uses the formula: X = X - min(X))/(max(X)-min(X))*(nmax-nmin)+nmin this produces a [nmin,nmax] I chose 2 and -2 just like Yilian did in her example paper. • Data Zero Mean was the one I used to find the results primarily as this was Yilian’s suggestion the formula is: X = (X – mean(X))/std(X) this produces values between [0,1].
What did I find out?From 1990 West Philadelphia Data • Income is surprisingly not the greatest predictor in these sections of Philadelphia as to where people live. • R^2 was only .492 and mse was 10.4. • Rent is a decent predictor of Housing value R^2 was .682 and mse was 11.2. • Homeownership was a decent predictor of Housing value. R^2 was .661 and mse was 6.3.
What did I find out?From 2000 West Philadelphia Data • 12 Features. • Housing Value vs. Ethnicity (White, Black, Other, and Hispanic) did not have a correlation except for Black had a correlation of .483 and mse of 11.6. • Living in a residence or geographic area for a period of 5-years did have a significant correlation with R^2 around 1 and mse at 0.37.
What did I find out?From 2000 West Philadelphia Data • High School correlation was relatively high at .874 and mse of 7. • Non Manual Worker, Unemployment, Overcrowding, and Poverty had significant correlations with R^2 near 1 and mse of about .38. • Vacancy had a R^2 of .446 and mse of 11.5 • Number of Family units did not have that much of a correlation.
What did I find out?From 2000 West Philadelphia Data • Average Family size had a significant correlation near R^2 of 1 and mse of .34. • So the conclusion of my findings is that Same House (Past 5-years), Same County (Past Five Years), Non Manual Workers, Overcrowding, Average Family Size all have remarkably high correlations. Then comes HS graduate and lastly Blacks and Vacancy.
What did I find out?From 2000 Southwest Philadelphia Data • In the interest of brevity I will just state the conclusions for SW Philadelphia. The features with the highest correlation where Same House (Past 5-years), Same County (Past- 5 years), From another county (5 – years ago), High School Graduate, Non Manual Workers, Unemployment, Overcrowding, Poverty, and Vacancy.
What did I find out?From 2000 Southwest Philadelphia Data • Housing again had a stronger correlation perhaps from the neighborhood being better with R^2 at .709 and mse 9.3. • Rent had a correlation of R^2 at 71.1 and mse at 9.8 • Conclusion many of the features are seen as being close to one in both West Philadelphia and SW Philadelphia. With Housing and Rent very close to each other. • Vacancy was the only real exception perhaps because SW Philadelphia is in a better neighborhood.
What did I learn from the Matlab Program? • Matlab handles Matrix operations superbly. • Normalization is a powerful technique to get the data to be within a range to be analyzed. • The Data Normalization were about the same except for Decimal Scaling which gave some different answers than the ones I was getting. The other two methods worked quite well.
What happened with the Excel Data Analysis for West Philadelphia 1990? • I analyzed the three features which had R^2 of .744. • It came up that the p-value was beyond the 0.05 for rent. • So I built a linear equation based off of all values but this after running another analysis without rent. • This was: Y = βX + βX +β so Y = 3.3920X (Income) -942.0553X (Home Ownership) + 23472.1603. • This linear equation had an R^2 of .735.
What happened with the Excel Data Analysis for West Philadelphia 2000? • I analyzed the 12 features. • This multilinear regression had a R^2 of .744. • The p-values for where below 0.05 except for HS Grad and Blacks so I reran the Excel Analysis without this data and came up with an a linear equation: Y = βX + βX + βX + βX + βX + βX + βX + βX+ β Y=2012.0562X(Whites)+3706.9261X(Hispanic)-15026997.65(Same House 5 -Years)- 10776738.57(Same County 5 – Years)-7618762.411X(Non-Manual)- 42139526.18(Unemployment)-4198729.442X(Avg. Family Size)+ 5117.7525(Change in House Units) + 9102241.005 • This regression had an R^2 of .700.
What happened with the Excel Data Analysis for South West Philadelphia 2000? • I analyzed the seven features which had an R^2 of .829. • The p-values where all out of range of 0.05 except for HS Graduate. • A linear model could not really be formed. • Maybe not enough samples.
What are some conclusions? • Income is not that big a factor maybe because not in upscale neighborhood (One obviously needs income however). • Rent is a good predictor of house value. • Homeownership is a good predictor of house value. • The social features all had high correlations (Same House (Past 5-years), Same County (Past- 5 years), From another county (5 – years ago), High School Graduate, Non Manual Workers, Unemployment, Overcrowding, Poverty, and Vacancy – for SW Phila). • Ethnicity not really a factor.
What does running Matlab look like? • Run the Project script for West Philadelphia. • Show the Matlab program, how the R^2 and mse values as they are generated.