Download
1 / 36
360 likes | 774 Views
Tools and Analysis to Support Freight System Resilience. Transportation Logistics Spring 2009. Why Resilience?. Supply chains leaner and longer Sense that disruptions are or will become, more common Significant economic consequences from disruptions A complex problem. Complexity.

E N D
Tools and Analysis to Support Freight System Resilience Transportation Logistics Spring 2009
Why Resilience? • Supply chains leaner and longer • Sense that disruptions are or will become, more common • Significant economic consequences from disruptions • A complex problem
Complexity • Enterprises are dynamic actors • Economics are not well documented and vary by organization • Multitude of events and consequences • External disruptions outside the purview of transportation • Consequences depend on actions • Existing economic models poorly suited
Temporal Component • Mitigation • Preparedness • Response • Recovery
Agenda • Enterprise behavior • Infrastructure connectivity and flow • Washington Potatoes
WSDOT Phase 1 Recommendations • Identify and Segment Customers of the Transportation System • Identify and quantify the objective of a FSR Plan for this region • Conduct a vulnerability assessment of the region’s transportation network • Create public/private collaboration mechanisms • Determine what regulatory and policy procedures need to be put into place • Agree on priority and trigger setting processes • Conduct a small-scale in-house simulation • Test the plan with a large scale simulation
Enterprise Behavior • As users of the system enterprises also contribute to system performance • Better enterprise planning creates better outcomes • Understanding enterprise behavior allows us to understand the current behavior and triggers
Types of Disruptions • Supply • Demand • Administrative • Resource availability • Transportation
Summary • Response to transportation disruption correlated with level of other risks inherent in supply chain • Tactics decrease efficiency and competitiveness outside of disrupted periods • Operational and communications solutions offer benefit in most cases
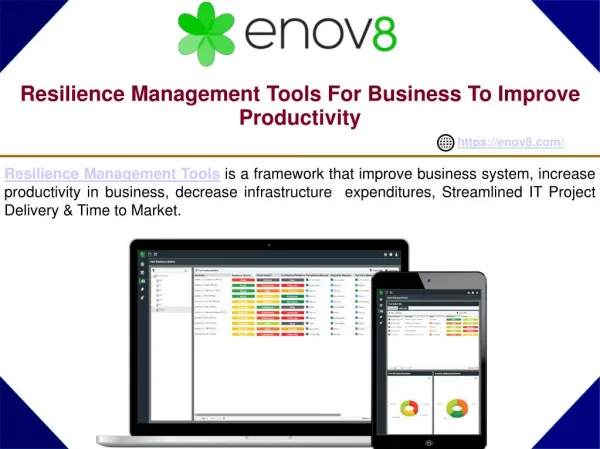
GIS Tool Development • Intermodal layer for each mode and terminal type • Cost functions to capture “cost” of flow along a link • Logic to ensure connectivity and capture capacity constraints • Can measure transportation impacts of capacity reductions and closures using scenario analysis
Case Studies • WA Potatoes • Fresh and processed • Fresh to market • Estimate consequences of 24 hour closure of I-90 • WA Fuel • Terminal racks to diesel stations • Identify infrastructure weaknesses and dependencies • Identify priority access routes
Goals • Estimate the truck trips per day within the state of Washington that are necessary to move potatoes between production locations, processing facilities, and consumption locations. • Consider a disruption to the transportation network, and identify the impact on these truck trips.
Motivation for the Potato Case Study • Exercise the GIS tool • Identify the level of effort and data collection challenges of this approach to understanding the impacts from disruptions • Understand the movements of potatoes in the state
Potato Data Elements • Potato prices at field, retailer purchase price, and retail price • Origins and destinations for potatoes and potato products • Volumes of potatoes for each origin and destination for all potato products • Quantity of potato loss • Ratios of fresh potatoes to potato products • Percentage of potatoes processed into each product in each growing region • Volume of potatoes held in a truckload for each product • Location and type of potato processors • Mode split • Exit points for potatoes destined for locations outside the state
Data Sources • AC Neilson • United States Department of Agriculture • Market News • National Agriculture Statistics • Washington State Potato Commission/WSU Survey • Discussions with ConAgra Foods/Lamb Weston • State of Washington Potato Committee (SWPC): Disposition
Comments on potato production • Modeled potato production as 3 regions, all trips originate in centroids of these regions • 94% capture rate
Potato Truck Trips • Under normal conditions potato trucks generate just over 11,000 truck miles each day
Disruption • Close the Cascade mountain passes on I-90, Highway 2, and Highway 12 for one day to replicate the impact of a severe winter storm. • SR410 and Highway 20 are closed seasonally. • Re-route the potato trucks to the next shortest path between their origin and destination. • 20% of all truck trips cross the Cascades.
Eastbound favors fresh and northern routes I90 carries most traffic Westbound traffic 70% frozen
All rerouted onto SR14 Impacts 50 trucks per day, 45 westbound and 5eastbound Total truck-milesincrease to about21,000 miles per day, an increaseof 78% Greatest impactto frozen potatoestraveling to Westernmarkets
Economic Implications • Direct Costs • Driver wages, fuel consumption, vehicle operating costs • $13,722 to $32,018 per day or $275 to $640 dollars per truck • Indirect Costs • Missed business opportunities, spoiled products, extra transportation costs