Download
1 / 103
1.03k likes | 1.46k Views
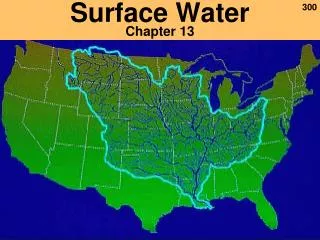
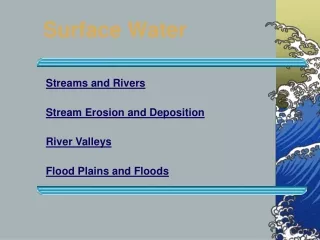
Surface Water. The Lane Diagram. WATER. SEDIMENT. I. Events During Precipitation A. Interception B. Stem Flow C. Depression Storage D. Hortonian Overland Flow E. Interflow F. Throughflow -> Return Flow G. Baseflow. II. Hydrograph A. General .

E N D
The Lane Diagram WATER SEDIMENT
I. Events During PrecipitationA. InterceptionB. Stem Flow C. Depression StorageD. Hortonian Overland Flow E. Interflow F. Throughflow -> Return Flow G. Baseflow
II. HydrographA. General B. Storm Hydrograph 1. Shape and Distribution of “events”
II. HydrographA. General B. Storm Hydrograph 1. Shape and Distribution of 2. Hydrograph Separation
II. HydrographA. General B. Storm Hydrograph 1. Shape and Distribution of 2. Hydrograph SeparationC. Predicting the rate of Baseflow Recession after a storm
III. Rainfall-Runoff RelationshipsA. Time of Concentration“The time required for overland flow and channel flow to reach the basin outlet from the most distant part of the catchment”
III. Rainfall-Runoff RelationshipsA. Time of Concentration“The time required for overland flow and channel flow to reach the basin outlet from the most distant part of the catchment” tc = L 1.15 7700 H 0.38
III. Rainfall-Runoff RelationshipsA. Time of Concentration“The time required for overland flow and channel flow to reach the basin outlet from the most distant part of the catchment” tc = L 1.15 7700 H 0.38 tc = time of concentration (hr) L = length of catchment (ft) along the mainstream from basin mouth to headwaters (most distant ridge) H = difference in elevation between basin outlet and headwaters (most distant ridge)
L = 13,385 ft H = 380 ft III. Rainfall-Runoff RelationshipsA. Time of Concentrationexample problem tc = L 1.15 7700 H 0.38
L = 31,385 ft H = 380 ft Tc = 0.75 hrs, or 45 minutes tc = (13,385)1.15 7700 (380) 0.38 tc = time of concentration (hr) L = length of catchment (ft) along the mainstream from basin mouth to headwaters (most distant ridge) H = difference in elevation (ft) between basin outlet and headwaters (most distant ridge)
III. Rainfall-Runoff RelationshipsA. Time of ConcentrationB. Rational Equation
III. Rainfall-Runoff RelationshipsA. Time of ConcentrationB. Rational EquationIf the period of ppt exceeds the time of concentration, then the Rational Equation applies
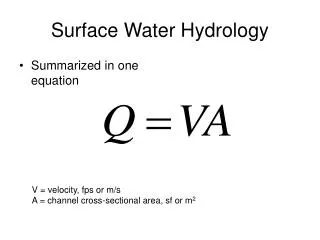
III. Rainfall-Runoff RelationshipsA. Time of ConcentrationB. Rational Equation Q=CIA
III. Rainfall-Runoff RelationshipsA. Time of ConcentrationB. Rational Equation Q=CIA Where Q=peak runoff rate (ft3/s) C= runoff coeffic. I = ave ppt intensity (in/hr) A = drainage area (ac)
First: solve for time of concentration (“Duration”); THEN: solve for rainfall intensity for a given X year storm.
III. Rainfall-Runoff RelationshipsA. Time of ConcentrationB. Rational Equationexample problem The drainage basin that ultimately flows past the JMU football stadium is dominated by an industrial park with flat roofed buildings, parking lots, shopping malls, and very little open area. The drainage basin has an area of 90 acres. Find the peak discharge during a storm that has a 25 year flood return interval.
First: solve for time of concentration (“Duration”); THEN: solve for rainfall intensity for a given X year storm. “45 minutes from previous exercise”
III. Rainfall-Runoff RelationshipsA. Time of ConcentrationB. Rational Equationexample problem The drainage basin that ultimately flows past the JMU football stadium is dominated by an industrial park with flat roofed buildings, parking lots, shopping malls, and very little open area. The drainage basin has an area of 90 acres. Find the peak discharge during a storm that has a 25 year flood return interval. Q = ciA
III. Rainfall-Runoff RelationshipsA. Time of ConcentrationB. Rational Equationexample problem The drainage basin that ultimately flows past the JMU football stadium is dominated by an industrial park with flat roofed buildings, parking lots, shopping malls, and very little open area. The drainage basin has an area of 90 acres. Find the peak discharge during a storm that has a 25 year flood return interval. Q = ciA Q = (0.85)*(2.5 in/hr)*(90 acres)
III. Rainfall-Runoff RelationshipsA. Time of ConcentrationB. Rational Equationexample problem The drainage basin that ultimately flows past the JMU football stadium is dominated by an industrial park with flat roofed buildings, parking lots, shopping malls, and very little open area. The drainage basin has an area of 90 acres. Find the peak discharge during a storm that has a 25 year flood return interval. Q = 191.3 ft3/s
III. Rainfall-Runoff RelationshipsA. Time of ConcentrationB. Rational Equationexample problem The drainage basin that ultimately flows past the JMU football stadium is dominated by an industrial park with flat roofed buildings, parking lots, shopping malls, and very little open area. The drainage basin has an area of 90 acres. Find the peak discharge during a storm that has a 25 year flood return interval. Calculate the mean velocity if the cross sectional area of the channel is 40 ft2.
III. Rainfall-Runoff RelationshipsA. Time of ConcentrationB. Rational Equationexample problem An industrial park with flat roofed buildings, parking lots, and very little open area has a drainage basin area of 90 acres. The 25 year flood has an intensity of 2 in/hr. Find the peak discharge during the storm. Calculate the mean velocity if the cross sectional area of the channel is 40 ft2. Discharge = Velocity x Area
III. Rainfall-Runoff RelationshipsA. Time of ConcentrationB. Rational Equationexample problem An industrial park with flat roofed buildings, parking lots, and very little open area has a drainage basin area of 90 acres. The 25 year flood has an intensity of 2 in/hr. Find the peak discharge during the storm. Calculate the mean velocity if the cross sectional area of the channel is 40 ft2. Discharge = Velocity x Area 191.3 ft3/s = 40ft2 * V V = 4.8 ft/s
Calculate the mean velocity if the cross sectional area of the channel is 40 ft2. Discharge = Velocity x Area 191.3 ft3/s = 40ft2 * V V = 4.8 ft/s or 146.3 cm/s If the channel is made of fine sand, will it remain stable?
Hjulstrom Diagram 146.3 cm/s 0.10-0.25 mm (fine sand) size range
III. Measurement of StreamflowA. Direct MeasurementsB. Indirect Measurements
III. Measurement of StreamflowA. Direct Measurements 1. Price /Gurley/Marsh-McBirney Current Meters