Download
1 / 32
320 likes | 420 Views
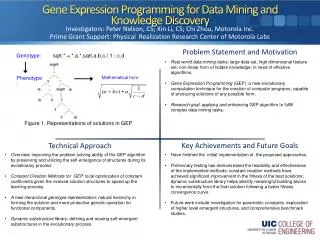
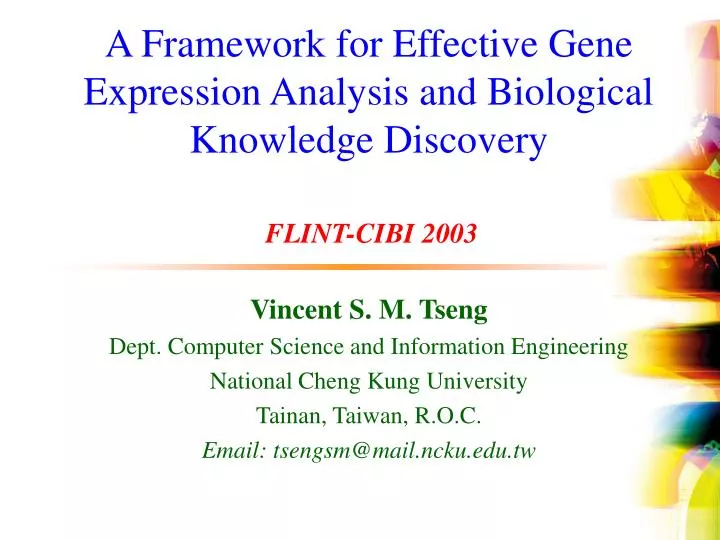
A Framework for Effective Gene Expression Analysis and Biological Knowledge Discovery. FLINT-CIBI 2003. Vincent S. M. Tseng Dept. Computer Science and Information Engineering National Cheng Kung University Tainan, Taiwan, R.O.C. Email: tsengsm@mail.ncku.edu.tw. Outline.

E N D
A Framework for Effective Gene Expression Analysis and Biological Knowledge Discovery FLINT-CIBI 2003 Vincent S. M. Tseng Dept. Computer Science and Information Engineering National Cheng Kung University Tainan, Taiwan, R.O.C. Email: tsengsm@mail.ncku.edu.tw
Outline • Goal of the Framework (GeneFilter) • Architecture of GeneFilter • Main Functions of GeneFilter • Preprocessing Module • Analysis Module • Gene Ranking Module • Feedback Validation Module • Future Directions
Goal of GeneFilter Framework • Insufficiency in existing gene expression analysis tools: • Intelligence; Automation; High Integration; Efficiency • We aim to develop an intelligent, integrated, automatic, and high-performance gene expression analysis platform by using various soft-computing methods for finding out interesting genes for complex analysis targets • Applications on disease analysis • Starting from bladder cancer analysis • Extension to other diseases like lung cancer, etc.
Preprocessing • Handling of Missing Gene Information • Query BioDB • Normalization Methods • Integration of various normalization methods • Quality Analysis • Handling of missing expression data • Integration of regression and clustering techniques • Identification of defect data • By statistics and feedback analysis
Normalization Methods • To remove systematic effects (mRNA abundance effect, chip effect, block effect,… ) Ymjkg = mRNAm + Chipi + Dyej + Blockk + Geneg + emjkg • Median normalization • Lowess normalization:Dudoit et al. (2001) • etc.
Analysis Module • Expression Patterns Analysis • Gene Chips Correlation Analysis • Clustering Analysis • Classification Analysis
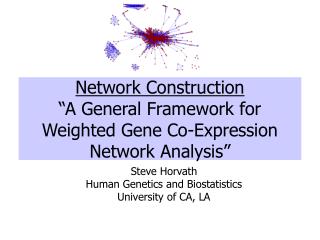
Expression Patterns Analysis • Definition of Expression Patterns • e.g. set t = 0.5 (other criteria provided) y If x>t and y>t, we consider this gene as up-regulated in stages S1->S2 and S2->S3 x S1 S2 S3
Effective Microarray Clustering [Tseng 02] • Iterative and “Divide-and Conquer” computation for automatic mining • CAST-based algorithm for clustering efficiency • Hubert’s Γ statistic for validating clustering results
Effective Microarray Mining [Tseng 02] (cont.) 1. Narrow down the threshold range 2. Split and Conquer: find “nearly-best” result LM: Left Margin RM: Right Margin LM RM 0 100% Affinity Threshold (t)
Experimental Evaluation • Original dataset • Data source: Lawrence Berkeley National Lab (LBNL) (http://rana.lbl.gov/EisenData.htm) • microarray expression data of yeast saccharomyces cerevisiae • contain the expressions of 6221 genes under 80 experimental conditions • Testing datasets • Dataset I: low similarity dataset (avg similarity: 0.137) • Dataset II: high similarity dataset (avg similarity: 0.696)
Experimental Evaluation:Low Similarity Dataset Table 1. Experimental results (dataset I) Table 2. Distribution of clusters (dataset I)
Experimental Evaluation:High Similarity Dataset Table 3. Experimental results (dataset II) Table 4. Distribution of clusters (dataset II)
Time Series Clustering: Main Problems Incurred Absolute offset Scaling Shift Noise
Time Series Clustering(cont.) Time Point Pearson correlation coefficient: -0.50936 Data from [Spellman 98]
Time Series Clustering (cont.) Time Point Pearson correlation coefficient: 0.62328
mismatch M. Input : Two gene expression time series S, T and number of allowed Output : The time series similarity between S and T. Method : CDAM(S, T, M). Procedure CDAM(S, T, M){ transfor m the sequences S and T into rank value sequences Q and R; = for m 0 to M{ <= calculate r(i, j) for all i, j N to find the minimum D of (Q, R); alignment (Q' , R' ) with mismatch m trace the warping path of minimum D; } best alignment (S' , T' ) the alignments (Q' , R' ) whose similarity is highest; return the similarity of (S, T); } Proposed Method: Correlation-based Dynamic Alignment with Mismatch (CDAM) Sequence Transformation Find the best alignment
Empirical Evaluation • Gene expression data • Cho/Spellman’s time series microarray data of 6178 yeast genes under 18 time points • 255 distinct genes were included in the dataset when mapping 343 known activations onto Spellman data set [Filkov 01] • Similarity of the genes in the 343 activations
Ranking Genes Genes list is (ABC) and (GenAsia) and (DiGiGen.) list R1: sum of differences between two sample R2:Chi-square value
Feedback Validation • Biological Experiments • Q-PCR (Quantitative real time polymerase chain reaction-Q-PCR ) • 2D Gel • Validation • Assessing Preprocessing Protocols • Assessing Analysis Protocols
Conclusions • GeneFilter • http://biosys.csie.ncku.edu.tw/genefilter/index.jsp • Has been applied on analysis of bladder cancer, hepatitis diseases, etc. • Short turnaround time for analysis • In benefits of high integration • Effective analysis results • Narrow down the interesting genes from 10,000+ to 50 genes
Future Directions • Future Directions • Incorporation of more soft-computing methods • Fuzzy logic for • Clustering & similarity measurement • Classifications • Quality validation • Gene Ontology Analysis • Applications on more disease analysis
Acknowledgement • Collaborators • Prof. H. S. Liu (NCKU) • Prof. N. H. Cho (NCKU) • Prof. C. L. Ho (NCKU) • Prof. J. H. Chiang (NCKU) • Prof. Y. L. Sheh (NSYSU) • Prof. H. L. Wu (NCKU) • Sponsoring • National Science Council, Taiwan
Thanks Email: tsengsm@mail.ncku.edu.tw
Example Goal of Gene Expression Analysis Interesting Gene set