Download
1 / 14
140 likes | 264 Views
Seawater Desalination in California: Energy and Greenhouse Gas Emissions. Heather Cooley October 3, 2013 CalDesal Annual Conference; San Diego, CA. New Pacific Institute Analyses. Proposed plants Cost and financing Energy use and greenhouse gas emissions Marine Impacts Intakes Discharge

E N D
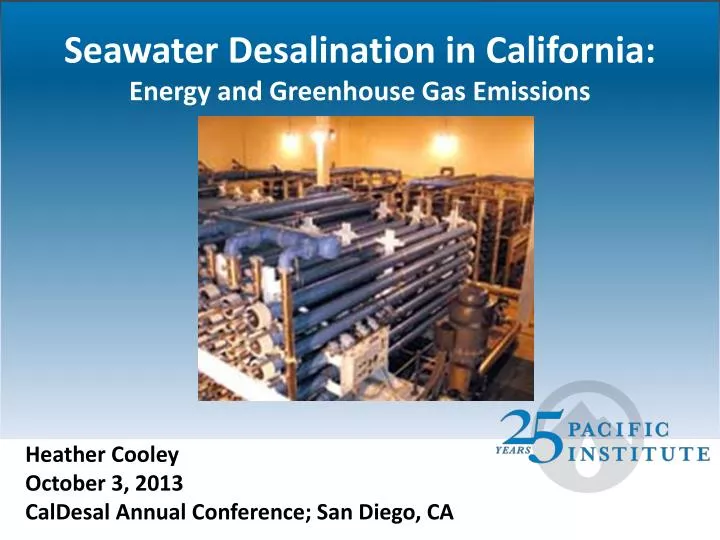
Seawater Desalination in California:Energy and Greenhouse Gas Emissions Heather Cooley October 3, 2013 CalDesal Annual Conference; San Diego, CA
New Pacific Institute Analyses • Proposed plants • Cost and financing • Energy use and greenhouse gas emissions • Marine Impacts • Intakes • Discharge • Permitting process
Currently Proposed Seawater Desalination Plants 17 proposed plants along the CA coast and 2 in Mexico
Desalination Energy Requirements 12,000-18,000 kWh per million gallons Theoretical minimum for RO is around 3,400 kWh per million gallons for 40% recovery (for RO process only) Source: Kennedy/Jenks Consultants. (2011). Energy White Paper: Perspectives on Water Supply Energy Use. Prepared for the City of Santa Cruz and Soquel Creek Water District scwd2 Desalination Program
Energy and Cost • Total energy costs are high, leading to increased exposure to short-term and long-term energy price variability • Long-term: CPUC estimates that electricity prices will rise by nearly 27% from 2008 – 2020 • Short-term: precipitation affects costs
Correlation Between Precipitation and Retail Energy Price for Six CA Utilities
PG&E’s Retail Energy Rates Versus California’s Two-Year Precipitation Totals for the Two Previous Years, 1982–2010 2-year Precipitation Totals (inches)
Energy and GHG Emissions • Global Warming Solutions Act • California must reduce greenhouse gas emissions to 1990 levels by 2020 • 4.8 MMTCO2e from the water sector • Expanding the state’s seawater desalination capacity by 514 MGD would: • Increase energy use by about 2,800 GWh per year (1% increase above current electricity use) • Generate 1.0 MMTCO2e annually (0.2% increase above current emissions
Regulatory Framework • California Environmental Quality Act • California Coastal Commission • Integrated Regional Water Management Planning Guidelines
GHG Reduction Strategies: Reduce Total Energy Requirements • More efficient pumps • Energy recovery devices • Higher-permeability membranes • Utilization of waste or low-grade heat • Hybrid membrane-thermal desalination • Alternative desalination technologies, e.g, forward osmosis and membrane distillation
GHG Reduction Strategies: Renewables and Carbon Offsets • Powering the plant directly with renewable energy • Powering the plant indirectly with renewable energy • Renewable energy carbon offsets
Thank you! For more information, go to www.pacinst.org
654 13th Street, Preservation Park, Oakland, CA 94612Phone:: (510) 251-1600 Email:info@pacinst.orgWeb:www.pacinst.org