Download
1 / 52
520 likes | 685 Views
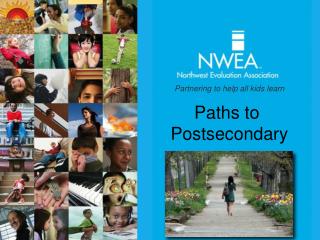
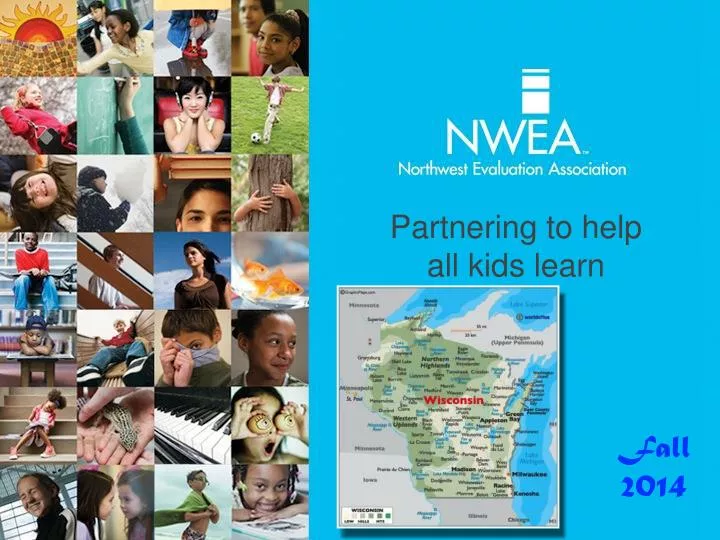
Partnering to help all kids learn. Fall 2014. Partnering to help all kids learn. NWEA’s Vision: A world in which education is kid-centric, relying on accurate and comprehensive data to inform each child’s optimal learning path. Today’s Agenda. MAP is what’s RIT with the World of Education

E N D
Partnering to help all kids learn • Fall • 2014
Partnering to help all kids learn NWEA’s Vision: A world in which education is kid-centric, relying on accurate and comprehensive data to inform each child’s optimal learning path.
Today’s Agenda • MAP is what’s RIT with the World of Education • MAP as an SLO “Evidence Source” • NWEA Norming Process and Products • MAP Reports We Recommend to Facilitate SLO Development • MAP Data Growth Calculators
RIT Scale…is like a: • 221 • X • x • x • x • x • x • X • RIT (Rasch Unit) Scale • 207 • x • x • x • x • x • x • x • 194 • X • Equal interval • RIT SCALE • Linked to C.C.S.S. • Adult Reading • Cross graded measurement • Grace • Shows growth over time • Greater score precision • Functions like an academic ruler • Norm • Beginning Reading • Daniel
What Is A “RITScore?” • Number (between 110-300) where your child is performing consistently • It’s their “Instructional Level” score • It can be called their “Ready To Learn Score” • It is NOT a score of “Mastery” or “Proficiency”
SLO, DPI and MAP, Oh MY! • Can MAP be used as the • District-Adopted • Standardized Assessment for • SLO Development? • “MAP would be considered appropriate (e.g., as a district assessment or as evidence of an SLO). • Within our guidance, we would simply ask local staff to determine if they want to use MAP for summative evaluation purposes, when they likely originally purchased it for formative purposes.”
Using MAP As an SLO Evidence Source
Evidence Sources • MAP Data can be the “Evidence Source” according to the DPI SLO Process Guide. • Assessments utilized for SLO Development need to be “valid, reliable, fair and unbiased for all students/ target population.” • Progress (needs to be) “continuously monitored and an appropriate amount of evidence can be collected in time for use in final scoring conference.”
Using MAP Data • to • Develop Student Learning Objectives • SLOs
Getting There • Order Reports • Client-Server MAP Web-Based MAP
NWEA offers many resources and calculators on our website: http://www.nwea.org/support/article/norms-study-resources Norms/Growth Review
- NWEA tests around 8 million students each year, and re-norms the results every three* years. • - The norm study communicates “status” norms (where each student is in relation to his/her peers). Norms/Growth Review
Grade 3 • Math • Fall-Spring • 6 6 8 6 5 7 6 2* • - The norm study also communicates “growth” norms, based on the starting RIT for each individual student. • 210 211 212 213 214 215 216 217 • - We report the growth we observe for each RIT starting point in each grade level. We usually refer to that as PROJECTED/TYPICAL growth. • * For Example ONLY…NOT actual growth numbers • - Many NWEA partner schools refer to that as a growth TARGET for a student, class, grade level, school or district. Norms/Growth Review
Norms DON’T Control: • Norms don’t control for factors “outside a teacher’s control,” • such as: • Special Education Status • SES or Poverty Status • Norms can/should be used to INFORM, but they are not definitive statements.
The Need for • CONTEXT • Context helps set goals that are fair and realistic for teachers, and keep student learning at the forefront.
The Need for CONTEXT • Historical Context • “How much growth have my students previously shown? What was the prior achievement level of my students?” • Similar Student Context • “How much growth do SIMILAR students show?” • Classroom/School Context • “Do the students in my classroom/school have similar characteristics that may influence how much growth they show?” • Goal Context • “Is this a SAFETY goal or a STRETCH goal?”
Digging Deeper into Status/Growth Norms
Status Norms • What do they do? • Status Norms inform us how the growth for a grade level of students within a school compares to the growth of other groups of students in that same grade level across the country. • QUESTION – How does the status placement of my group of 4th graders in math compare to the status/percentile of other groups of 4th graders in schools across the country • What does it tell you? • Provides a national context for the achievement of a grade (with the 50th percentile representing average achievement) • EXAMPLE—If your 4th graders have an average score of 205.8 in math in the fall, these students would be at the 72nd percentile compared to other groups of 4th graders in schools across the country.
Introducing the School Norms Calculator • This Excel document has many formulas embedded in the document which help you customize the norms and make the norms work for you. • Make sure you “Enable Macros” in your Excel preferences.
Introducing the School Norms Calculator • Please know that the “User Guide” is located at the bottom of the calculator. • When you return to your office, and forget how to use the School Norms Calculator… • The “User Guide” will help you remember what we discussed today.
This Calculator Can ProvideGrowth Percentile Information for Individual Grades Within Schools/Districts
The Same Calculator Will Provide PERCENTILE Ranks for Grade Levels Within Schools
Considerations • Benefits • - Does not consider other unique class or school factors (ex. High percentage of low-SES students) • - Norming information is at the grade level, not the class • - Growth reflects changes or improvements over the measured period • - Places growth into a context of grades across the country • - Considers starting achievement level for students at the beginning of the year • - Can set future growth goals based on prior data Benefits & Considerations
Considerations • Benefits • Norming information is at the grade level not the class level • Does not consider other unique class or school factors (ex. High percentage of low-SES students) • Can quickly see how your grade levels compare to other grade levels across the country • Can identify grade levels where extra support may be needed • Can use these data to set realistic goals for grade-level performance by the end of the year Benefits & Considerations
School Norms Calculator Activity • Your computer and the Excel Document called School Norms Calculator. • Make sure you “enable macros” in Excel • A copy of the Student Growth Summary Report • What you will need:
School Norms Calculator Activity • Choose “Reading,” “Fall,” and “Fall to Spring.” • Your school’s 5th grade Mean RIT was 205. Input that value in the “Grade Mean RIT Score” column for grade 5. • What was their STATUS percentile? • What would their STATUS percentile be if their Mean RIT was 207?
School Norms Calculator Activity • In the Norms Calculator, choose “Math,” “Fall,” and “Fall to Spring.” • Use the Norms Calculator to discuss a reasonable (SMART) Growth Goal. Consider what a “stretch” goal would look like for this school.
Using This Process to Inform SLO Creation • Use the NWEA Student Growth Summary Report/Calculator AND the SLO creation rubric to: • Identify curricular areas in which you would like to see growth • Identify RIT “Starting Points” • Create “rigorous, attainable” RIT growth trajectories • Identify/note the interval for mid-point check (probably your winter MAP window).
Percentage of Students who MEET or EXCEED Their Projected RIT - A Student-based SLO
Students who MEET or EXCEED • Their Projected RIT • What is This? • The PERCENTAGE of students who meet or exceed their individualized growth projection (based on starting RIT, grade & subject). • What QUESTION does this answer? “Of the 20, 4th grade students in a teacher’s classroom, what percentage of these students met or exceeded their fall to spring growth projection? • What does this TELL You? • This provides an indicator of how many students appear to be making reasonable progress between two test events (fall-spring, spring-spring, fall-fall). Normal percentage is between 50% and 55%. • Example “11 of the 20 (55%), of the 4th grade students met or exceeded their growth targets.
Considerations • Benefits • Norming information is at the grade level not the class level • Does not consider other unique class or school factors (ex. High percentage of low-SES students) • Can quickly see how your grade levels compare to other grade levels across the country • Can identify grade levels where extra support may be needed • Can use these data to set realistic goals for grade-level performance by the end of the year Benefits & Considerations • Benefits & Considerations
Click to edit Master text styles • Where do we FIND it? Where
Fall • Starting • Point • Did they • Reach Their • Projection? • Growth • Projection • RIT Points • Growth • Projection • Total RIT • By How Much • (+/-)? • Spring • Ending • Point What Does the ASG Report Tell Us?
PERCENTAGE • of • Students • who • Met/Exceeded • Projected RIT • COUNT • of • Students • who • Met/Exceeded • Projected RIT • Data for NEXT Calculator What Does the ASG Report Tell Us?
Be utilized in conjunction with the ASG Report • Predict data in a “what if” context for both Status & Growth Norms • Be utilized for small groups/individual students The Achievement Status & Growth (ASG) Calculator is designed to: ASG Calculator
Customized by • SUBJECT • Customized by • Grade Level • (1-10) ASG Calculator - CUSTOMIZED
The Need for CONTEXT • Historical Context • “How much growth have my students previously shown? What was the prior achievement level of my students?” • Similar Student Context • “How much growth do SIMILAR students show?” • Classroom/School Context • “Do the students in my classroom/school have similar characteristics that may influence how much growth they show?” • Goal Context • “Is this a SAFETY goal or a STRETCH goal?”
Use either YOUR ASG report or this SAMPLE ASG report and the ASG Calculator to answer the following questions: ASG Calculator Activity
Find a student/group of students in the report whose STATUS norm is below the 40th percentile. • Input both the beginning RIT AND a higher ending RIT value to discover what that student’s percentile would be with larger growth. • Experiment to find the most realistic stretch growth for this student/group of students. • Discuss how you would utilize this method to create realistic SLO Growth Goals. Choose the proper SUBJECT and Grade Level in the ASG Calculator. ASG Calculator Activity
Student Goal-Setting Worksheet • DISCUSSION II - How would the goal-setting process change if educators utilized College/Career Readiness targets to guide the goal-setting process? DISCUSSION - How could the utilization of the Growth Calculator impact setting individual RIT Growth Goals?
Next Steps • There are MANY Data Coaching opportunities available from NWEA. • They include: • Live Professional Development with an NWEA facilitator • Webinar discussions with NWEA researchers • Webinar discussions with your Wisconsin Account Managers • Webinar discussions with your Wisconsin Account Executive
All Kids Learn. We passionately believe it, and partner to make this an everyday reality for every child.