Download
1 / 28
300 likes | 763 Views
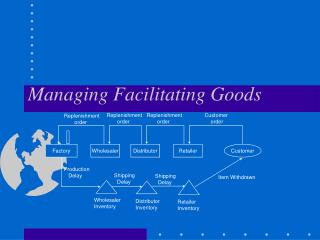
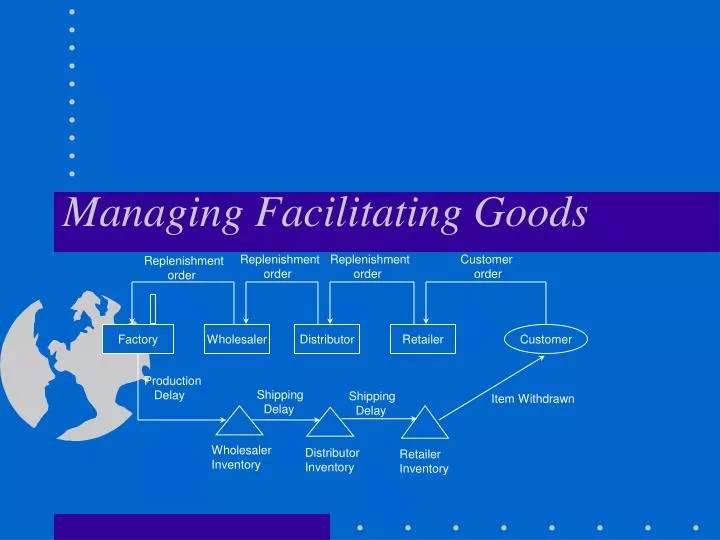
Managing Facilitating Goods. Replenishment order. Replenishment order. Customer order. Replenishment order. Factory. Wholesaler. Distributor. Retailer. Customer. Production Delay. Shipping Delay. Shipping Delay. Item Withdrawn. Wholesaler

E N D
Managing Facilitating Goods Replenishment order Replenishment order Customer order Replenishment order Factory Wholesaler Distributor Retailer Customer Production Delay Shipping Delay Shipping Delay Item Withdrawn Wholesaler Inventory Distributor Inventory Retailer Inventory
Learning Objectives • Discuss the role of information technology in managing inventories. • Describe the functions and costs of an inventory system. • Determine the order quantity. • Determine the reorder point and safety stock for inventory systems with uncertain demand. • Design a continuous or periodic review inventory-control system. • Conduct an ABC analysis of inventory items. • Determine the order quantity for the single-period inventory case. • Describe the rationale behind the retail discounting model.
Role of Inventory in Services • Decoupling inventories • Seasonal inventories • Speculative inventories • Cyclical inventories • In-transit inventories • Safety stocks
Considerations in Inventory Systems • Type of customer demand • Planning time horizon • Replenishment lead time • Constraints and relevant costs
Relevant Inventory Costs • Ordering costs • Receiving and inspections costs • Holding or carrying costs • Shortage costs
Inventory Management Questions • What should be the order quantity (Q)? • When should an order be placed, called a reorder point (ROP)? • How much safety stock (SS) should be maintained?
Inventory Models • Economic Order Quantity (EOQ) • Special Inventory Models With Quantity Discounts Planned Shortages • Demand Uncertainty - Safety Stocks • Inventory Control Systems Continuous-Review (Q,r) Periodic-Review (order-up-to) • Single Period Inventory Model
Inventory Levels For EOQ Model Units on Hand Q 0 Q Time D
EOQ Formula • NotationD = demand in units per yearH = holding cost in dollars/unit/yearS = cost of placing an order in dollarsQ = order quantity in units • Total Annual Cost for Purchase Lots • EOQ
Annual Costs for Quantity Discount Model 22,000 21000 20000 2000 1000 C = $20.00 C = $19.50 C = $18.75 Annual Cost, $ 0 100 200 300 400 500 600 700 Order quantity, Q
Inventory Levels For Planned Shortages Model Q-K Q TIME 0 -K T1 T2 T
Formulas for Special Models • Quantity Discount Total Cost Model • Model with Planned Shortages
Values for Q* and K* as AFunction of Backorder Cost B Q* K* Inventory Levels 0 0 0 undefined Q* 0
Demand During Lead Time Example = + + + u=3 u=3 u=3 u=3 ROP s s Demand During Lead time Four Days Lead Time
Safety Stock (SS) • Demand During Lead Time (LT) has Normal Distribution with - - • SS with r% service level • Reorder Point
Continuous Review System (Q,r) Amount used during first lead time Inventory on hand EOQ Reorder point, ROP Order quantity, EOQ d3 Average lead time usage, dL d1 d2 EOQ Safety stock, SS First lead time, LT1 LT2 LT3 Time Order 1 placed Order 3 placed Order 2 placed Shipment 1 received Shipment 2 received Shipment 3 received
Periodic Review System(order-up-to) Inventory on Hand Review period RP RP RP Target inventory level, TIL First order quantity, Q1 Q3 Q2 d3 d1 Amount used during first lead time d2 Safety stock, SS First lead time, LT1 LT2 LT3 Time Order 3 placed Order 2 placed Order 1 placed Shipment 3 received Shipment 1 received Shipment 2 received
Inventory Control Systems • Continuous Review System • Periodic Review System
Inventory Items Listed in Descending Order of Dollar Volume Monthly Percent of Unit cost Sales Dollar Dollar Percent of Inventory Item ($) (units) Volume ($) Volume SKUs Class Computers 3000 50 150,000 74 20 A Entertainment center 2500 30 75,000 Television sets 400 60 24,000 Refrigerators 1000 15 15,000 16 30 B Monitors 200 50 10,000 Stereos 150 60 9,000 Cameras 200 40 8,000 Software 50 100 5,000 10 50 C Computer disks 5 1000 5,000 CDs 20 200 4,000 Totals 305,000 100 100
Single Period Inventory ModelNewsvendor Problem Example D = newspapers demanded p(D) = probability of demand Q = newspapers stocked P = selling price of newspaper, $10 C = cost of newspaper, $4 S = salvage value of newspaper, $2 Cu = unit contribution: P-C = $6 Co = unit loss: C-S = $2
Single Period Inventory Model Expected Value Analysis Stock Q p(D) D 6 7 8 9 10 .028 2 4 2 0 -2 -4 .055 3 12 10 8 6 4 .083 4 20 18 16 14 12 .111 5 28 26 24 22 20 .139 6 36 34 32 30 28 .167 7 36 42 40 38 36 .139 8 36 42 48 46 44 .111 9 36 42 48 54 52 .083 10 36 42 48 54 60 .055 11 36 42 48 54 60 .028 12 36 42 48 54 60 Expected Profit $31.54 $34.43 $35.77 $35.99 $35.33
Single Period Inventory Model Incremental Analysis E (revenue on last sale) E (loss on last sale) P ( revenue) (unit revenue) P (loss) (unit loss) (Critical Fractile) where: Cu = unit contribution from newspaper sale ( opportunity cost of underestimating demand) Co = unit loss from not selling newspaper (cost of overestimating demand) D = demand Q = newspaper stocked
Critical fractile for the newsvendor problem P(D<Q) (Co applies) P(D>Q) (Cu applies) 0.722
Retail Discounting Model • S = current selling price • D = discount price • P = profit margin on cost (% markup as decimal) • Y = average number of years to sell entire stock of “dogs” at current price (total years to clear stock divided by 2) • N = inventory turns (number of times stock turns in one year) Loss per item = Gain from revenue S – D = D(PNY)
Topics for Discussion • Discuss the functions of inventory for different organizations in the supply chain. • How would one find values for inventory costs? • How can information technology create a competitive advantage through inventory management? • How valid are the assumptions for the EOQ model? • How is a service level determined for inventory items? • What inventory model would apply to service capacity such as seats on an aircraft?
Interactive Exercise The class engages in an estimation of the cost of a 12-ounce serving of Coke in various situations (e.g., supermarket, convenience store, fast-food restaurant, sit-down restaurant, and ballpark). What explains the differences?