Download
1 / 42
420 likes | 809 Views
International Environmental Problems and Policy. Office hours. PROFESSOR ZOLTÁN GROSSMAN 258 Phillips Hall 10:00-10:50 am MWF 836-4471 E-mail: grossmzc@uwec.edu Web: www.uwec.edu/grossmzc. Regions of the “World Village”. 333 East Asians 274 South Asians 132 Africans 120 Europeans

E N D
Office hours PROFESSOR ZOLTÁN GROSSMAN 258 Phillips Hall 10:00-10:50 am MWF 836-4471 E-mail: grossmzc@uwec.edu Web: www.uwec.edu/grossmzc
Regions of the “World Village” • 333 East Asians • 274 South Asians • 132 Africans • 120 Europeans • 86 Latin Americans • 50 North Americans • 5 from Oceania
Where we live • 452 in town • 548 in country
Ages • 310 children • 70 elderly • 610 between
Demographics • 22 children born • 9 people die • One-third of deaths are children under 5. • Numbers of elderly increasing rapidly.
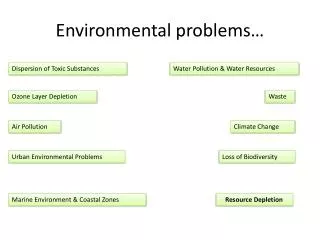
Human Population at 6 billion • Food shortages/famines • Water quality • Fossil fuel burning • Air and water pollution • Landscape destruction • Loss of biodiversity
Languages • 500 speak one of six languages • Chinese • English • Hindi • Spanish • Russian • Arabic • 500 speak one of 6,000 languages
Household income • Average annual income $4,890 • 600 poor • 300 marginal • 100 well-off
Ownership/consumption • 200 richest villagers own and consume 80% of goods • Other villagers own and consume remaining 20%
Material World: A Global Family Portrait Iceland Guatemala Japan
Land use • Average of 6 acres for each person • 700 acres cropland • 1400 acres pasture • 1900 acres woodland • 2000 acres desert, other noneconomic land
Land ownership The richest 270 people control: • 40% of the cropland • 72% of the foodgrain but feeds 27% of the people – 83% of the fertilizer
United States Population • 45 people live in U.S. • 955 live elsewhere
United States Consumption Oil 26% Aluminum 24% Copper 20% Nickel 19% Steel 13%
United States Share of World Pollution Toxic wastes 50% Nitrogen oxides 26% Carbon dioxide 26% Sulfur oxides 25% Chloroflurocarbons 22%
Rich/poor divisions • Wealthy countries tend to be located in the Northern Hemisphere. • About 1/5 of world population live in countries with per capita income > $25,000.00 (U.S.). • Poor people exist here as well. • Gap between rich and poor continues to increase. • Wealthiest 200 people in the world have combined wealth of $1 trillion - more than total wealth of poorest half (3 billion) of the world’s population.
Environmental challenges • Wealthy countries exploit natural resources in poor countries (often through corporations). • Elites in poor countries often cooperate with wealthy countries and interests. • Poor exploit natural resources, because socio-economic conditions (dictated by rich countries and domestic elites) create a struggle for survival. • Poor in wealthy countries also face economic blackmail. .
Philadelphia Infant Mortality Red area high than at least 28 Third World countries, including: Jamaica Cuba Costa Rica Malaysia Panama Sri Lanka South Korea Taiwan Uruguay Argentina Chile
Adult Literacy • 310 adults can read and write • 310 adults cannot read or write • Girls half as likely as boys to attend school
Access to TV • 10% without access • 90% with access
Access to fresh water • 30% of rural residents without access • 7% of urban residents without access
Women and girls • Two-thirds of manual labor • One-tenth of wages • One-hundredth of property • Make up 70% of the poor.
Life expectancy • Not age lived to, but affected by infant mortality rates. • Richest familes: women 80, men 78 • Poorest families: 48 for both
“North/South” Divisions • Poor countries tend to be located in Southern Hemisphere. • World Bank estimates more than 1.3 billion people (1/5 world population) live in acute poverty of < $1 (U.S.) per day. • 70% women and children • Self-Sustaining • Daily survival necessitates over-harvesting resources thus degrading chances of long-term sustainability.
Former world “divisions” • First World - Industrialized, market-oriented democracies of Western Europe, North America. • Second World - Centrally-planned socialist countries such as former USSR. • Third World - Ex-colonial nations such as India, Malaysia, Iran, etc. • Fourth World - Poorest nations (and indigenous communities within wealthy nations).
Current world system • Core - Industrialized, market-oriented democracies of Western Europe, North America, East Asia, Australia. • Periphery - Poor, ex-colonial nations such as Kenya, Bolivia, Pakistan, etc. • Semi-periphery - Partially industrialized ex-colonial nations (South Africa, Brazil, Mexico, South Korea, etc.)
Indigenous peoples • Indigenous (Native) people are often least powerful, most neglected people in the world. • At least half the world’s 6,000 distinct languages are dying. • Indigenous homelands may harbor vast percentage of world’s biodiversity. • Recognizing Native land rights and political rights may often be a solid ecological safeguard. • Who is “Indigenous”?
Human Development Index • United Nations releases Human Development Index (HDI). Based on social factors - ranges from 0-1.0. • In 2000: Canada had highest with 0.96 and Sierra Leone had lowest with 0.19. • Aggregate numbers hide many important inequity issues: • Gender • Race
Sustainable Development • “Meeting the needs of the present without compromising the ability of future generations to meet their own needs.” • Benefits must be available to all humans, not just sub-set of privileged group. • Economists: continual growth for people • Ecologists: non-renewable resources, limited waste capacity
Signs of hope • Progress had been made on many fronts. • Population has stabilized in many industrialized countries; population growth slowing in others. • Incidence of life-threatening diseases has been reduced in some countries. • Average life expectance nearly doubled.
World Summit onSustainable Development • Johannesburg, South Africa, Aug.-Sept. 2002 • Ten years after 1992 Earth Summit in Rio de Janeiro, Brazil (Rio + 10). • International grassroots NGOs used as opportunity for networking.
Earth Summit 2002 www.earthsummit2002.org UN site www.johannesburgsummit.org Linkages www.iisd.ca/wssd/portal.html Radio Earth Summit http://www.radioearthsummit.org/ Girona Declaration http://www.xs4all.nl/~ceo/un/gironadecl.html Global Indaba www.globalindaba.org.za Independent Media Center http://southafrica.indymedia.org/ WSSD websites