Download
1 / 21
210 likes | 383 Views
Scarcity and the Factors of Production. What is economics? How do economists define scarcity? What are the three factors of production?. What Is Economics?. Economics is the study of how people make choices to satisfy their wants For example:

E N D
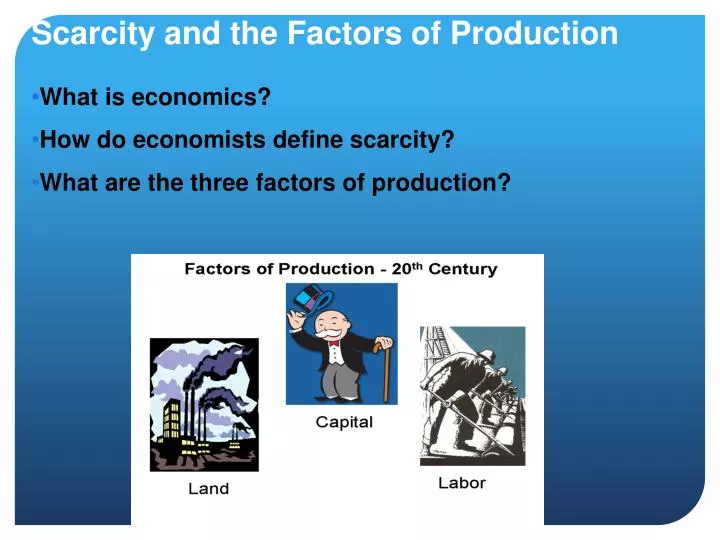
Scarcity and the Factors of Production • What is economics? • How do economists define scarcity? • What are the three factors of production?
What Is Economics? • Economics is the study of how people make choices to satisfy their wants • For example: • You must choose how to spend your time (sleeping, playing sports, working, doing homework). • Businesses must choose how many people to hire
Scarcity and Shortages • Scarcitylimited quantities of resources to meet unlimited needs or desires (always exist because our needs and wants always greater than the supply – fertile land, water, machines). • Shortages occur when producers will not or cannot offer goods or services at current prices (can be short or long term). 70’s not selling gas due to high prices.
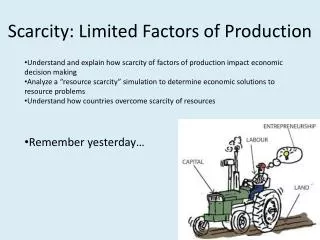
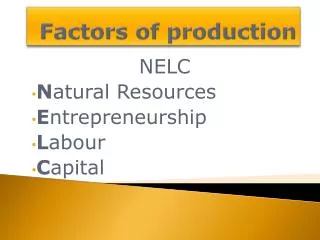
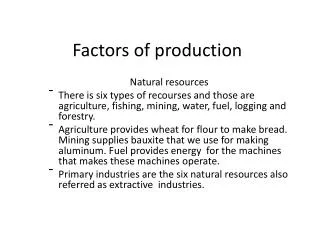
The 3 Factors of Production • Land All natural resources that are used to produce goods and services (coal, gas, soil, trees, sugar). • Labor Any effort a person devotes to a task for which that person is paid (shoveling, painting, driving. • Capital Any human-made resource that is used to create other goods and services (pencil, blender, saw, skills). Physical capital = buildings, tools, machines. Human capital = knowledge and skills workers obtain through education and experience.
The Factors of Popcorn Production Land Popping Corn Vegetable Oil Labor The human effort needed to pop the corn Capital Corn-PoppingDevice
Entrepreneurs • An entrepreneur= an ambitious leader who decides to combine land, labor, and capital to produce new goods and services (Bill Gates, Henry Ford, Fred Meijer, owner of Harding’s, etc.).
Section 1 Assessment 1. What is the difference between a shortage and scarcity? (a) A shortage can be temporary or long-term, but scarcity always exists. (b) A shortage results from rising prices; a scarcity results from falling prices. (c) A shortage is a lack of all goods and services; a scarcity concerns a single item. (d) There is no real difference between a shortage and a scarcity. 2. Which of the following is an example of using physical capital to save time and money? (a) hiring more workers to do a job (b) building extra space in a factory to simplify production (c) switching from oil to coal to make production cheaper (d) lowering workers’ wages to increase profits
Section 1 Assessment 1. What is the difference between a shortage and scarcity? (a) A shortage can be temporary or long-term, but scarcity always exists. (b) A shortage results from rising prices; a scarcity results from falling prices. (c) A shortage is a lack of all goods and services; a scarcity concerns a single item. (d) There is no real difference between a shortage and a scarcity. 2. Which of the following is an example of using physical capital to save time and money? (a) hiring more workers to do a job (b) building extra space in a factory to simplify production (c) switching from oil to coal to make production cheaper (d) lowering workers’ wages to increase profits
Opportunity Cost • Does every decision you make involve trade-offs? • How can a decision-making grid help you identify the opportunity cost of a decision? • How will thinking at the margin affect decisions you make?
Trade-offs and Opportunity Cost • Trade-offs are all the alternatives that we give up whenever we choose one course of action over others. • The most desirable alternative given up as a result of a decision is known as opportunity cost. All individuals and groups of people make decisions that involve trade-offs.
The Decision-Making Grid • Economists encourage us to consider the benefits and costs of our decisions. Karen’s Decision-making Grid Alternatives Sleep late Wake up early to study Benefits • Enjoy more sleep • Have more energy during the day • Better grade on test • Teacher and parental approval • Personal satisfaction Decision • Sleep late • Wake up early to study for test Opportunity cost • Extra study time • Extra sleep time Benefits forgone • Better grade on test • Teacher and parental approval • Personal satisfaction • Enjoy more sleep • Have more energy during the day
Thinking at the Margin • When you decide how much more or less to do, you are thinking at the margin. Options 1st hour of extra study time 2nd hour of extra study time 3rd hour of extra study time Benefit Grade of C on test Grade of B on test Grade of B+ on test Opportunity Cost 1 hour of sleep 2 hours ofsleep 3 hours of sleep
Section 2 Assessment 1. Opportunity cost is (a) any alternative we sacrifice when we make a decision. (b) all of the alternatives we sacrifice when we make a decision. (c) the most desirable alternative given up as a result of a decision. (d) the least desirable alternative given up as a result of a decision. 2. Economists use the phrase “guns or butter” to describe the fact that (a) a person can spend extra money either on sports equipment or food. (b) a person must decide whether to manufacture guns or butter. (c) a nation must decide whether to produce more or less military or consumer goods. (d) a government can buy unlimited military and civilian goods if it is rich enough.
Section 2 Assessment 1. Opportunity cost is (a) any alternative we sacrifice when we make a decision. (b) all of the alternatives we sacrifice when we make a decision. (c) the most desirable alternative given up as a result of a decision. (d) the least desirable alternative given up as a result of a decision. 2. Economists use the phrase “guns or butter” to describe the fact that (a) a person can spend extra money either on sports equipment or food. (b) a person must decide whether to manufacture guns or butter. (c) a nation must decide whether to produce more or less military or consumer goods. (d) a government can buy unlimited military and civilian goods if it is rich enough.
Production Possibilities Graphs • What is a production possibilities graph? • How do production possibilities graphs show efficiency, growth, and cost? • Why are production possibilities frontiers curved lines?
Production Possibilities • A production possibilities graph shows alternative ways that an economy can use its resources. • The production possibilities frontier is the line that shows the maximum possible output for that economy. Production Possibilities Graph 25 20 15 10 5 Watermelons (millions of tons) Shoes(millions of pairs) 0 15 a (0,15) 8 14 b (8,14) 14 18 20 21 12 9 5 0 Shoes (millions of pairs) c (14,12) d (18,9) e (20,5) A production possibilities frontier f (21,0) 0 5 10 15 20 25 Watermelons (millions of tons)
Efficiency • Efficiency means using resources in such a way as to maximize the production of goods and services. An economy producing output levels on the production possibilities frontier is operating efficiently. Production Possibilities Graph 25 20 15 10 5 S Shoes (millions of pairs) a (0,15) b (8,14) c (14,12) g (5,8) d (18,9) A point of underutilization e (20,5) f (21,0) 0 5 10 15 20 25 Watermelons (millions of tons)
Growth • Growth If more resources become available, or if technology improves, an economy can increase its level of output and grow. When this happens, the entire production possibilities curve “shifts to the right.” Production Possibilities Graph 25 20 15 10 5 Future production Possibilities frontier T S a (0,15) Shoes (millions of pairs) b (8,14) c (14,12) d (18,9) e (20,5) f (21,0) 0 5 10 15 20 25 Watermelons (millions of tons)
Cost • Cost A production possibilities graph shows the cost of producing more of one item. To move from point c to point d on this graph has a cost of 3 million pairs of shoes. Production Possibilities Graph 25 20 15 10 5 Watermelons (millions of tons) Shoes(millions of pairs) 0 15 8 14 c (14,12) 14 18 20 21 12 9 5 0 Shoes (millions of pairs) d (18,9) 0 5 10 15 20 25 Watermelons (millions of tons)
Section 3 Assessment 1. A production possibilities frontier shows (a) farm goods and factory goods produced by an economy. (b) the maximum possible output of an economy. (c) the minimum possible output of an economy. (d) underutilization of resources. 2. An economy that is using its resources to produce the maximum number of goods and services is described as (a) efficient. (b) underutilized. (c) growing. (d) trading off.
Section 3 Assessment 1. A production possibilities frontier shows (a) farm goods and factory goods produced by an economy. (b) the maximum possible output of an economy. (c) the minimum possible output of an economy. (d) underutilization of resources. 2. An economy that is using its resources to produce the maximum number of goods and services is described as (a) efficient. (b) underutilized. (c) growing. (d) trading off.