Download
1 / 13
130 likes | 241 Views
Planning for Performance Based Solutions. Brian Isaacson, AICP Program Director, MnDOT Metro Program Management. Overview. Process followed Initial results Problems… Reasonableness? Conclusions…. Process Followed. Developed traffic forecasts

E N D
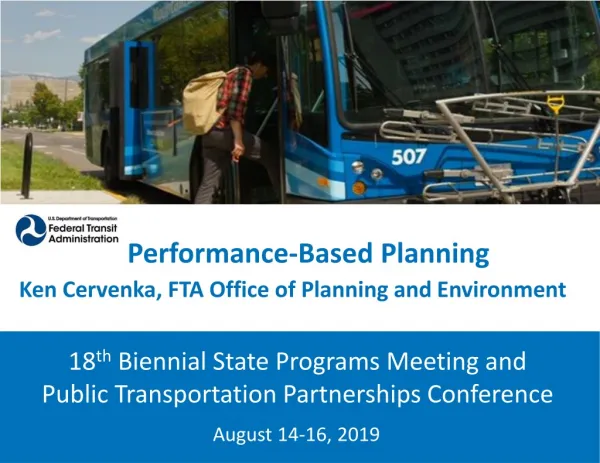
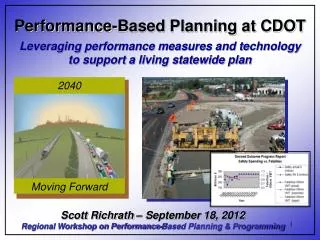
Planning for Performance Based Solutions Brian Isaacson, AICP Program Director, MnDOT Metro Program Management
Overview • Process followed • Initial results • Problems… • Reasonableness? • Conclusions…
Process Followed • Developed traffic forecasts • Based on Metro Council/State demographer population and employment forecasts • Used current regional plan network assumptions (almost no improvements in study area)
Initial results… • Traffic volumes – • Similar to those on I-494 in Bloomington • Design effect: • Called for 12 lane cross section on I-94, 6 lanes on TH 610 • Directional movements at many of the ramps connecting I-94 and TH 610 • High ROW need
Problems… • Forecasted volumes seemed high for the area • Peaking characteristics • Daily forecast volumes • Called demographic assumptions into question • Both had dramatic effect on potential design • Ancillary concern that at this scale, the project would potentially be too expensive to deliver in any reasonable timeframe
Reasonableness? • Re-examined demographics • Population and employment trends vs. expected 2030 figures • Revisited volumes at key locations • Entering volumes at District boundary exceeded what is possible…
What to do? • Need to make distinction between • Known/existing volumes and demographics • Those attributable to development that has yet to be realized/appear on the horizon • Update traffic forecasts based on revised demographics
Revised results • Volumes consistent with rest of the region • Design effect: • Analysis of existing vs. speculative volumes provides insights as to which movements are “required” • Potentially allows for reduced cross section (mainline I-94 and TH 610) • Reduced ROW imapcts under reduced cross section
Conclusions… • Risk assessment is an element of the overall forecasting process – now more than ever… • Rates of growth (demographic and volume) are all worth analyzing in greater detail • With the level of uncertainty in the current economic climate, the emphasis should be on known values (employment, population, volumes) as touchstones for analysis • Identifying the gap between existing and future – understanding the likelihood that the future
Closing thought… • The greater the discrepancy between known/existing values and projected values (and their potential effect on design/scope), the greater the need for understanding the probability of how long/under what circumstances will bring the future conditions to fruition