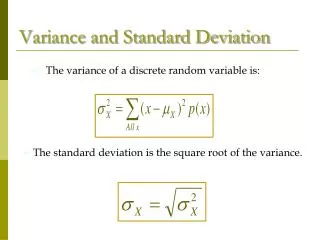
Download
1 / 17
170 likes | 340 Views
Standard Deviation and Variance (Class 2). OBJ: • Find range, measures of central tendency, and construct tables and graphs. Below are the algebra test scores for a class of 25 students:. Calculator commands: (at the bottom of the second page of notes)

E N D
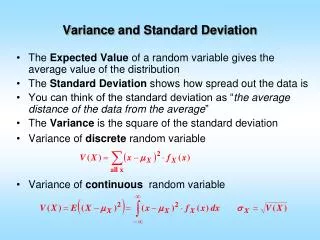
Standard Deviation and Variance (Class 2) OBJ: • Find range, measures of central tendency, and construct tables and graphs
Below are the algebra test scores for a class of 25 students:
Calculator commands: (at the bottom of the second page of notes) • STAT, 1 (for EDIT), 50,ENTER (repeat for all data), STAT, (for CALC), 1 (for 1-VAR STAT), ENTER (To clear data,▲L1, CLEAR, ENTER) • 2ND STAT (for LIST), (for MATH), 8, (for VARIANCE), 2ND 1 (for L1)
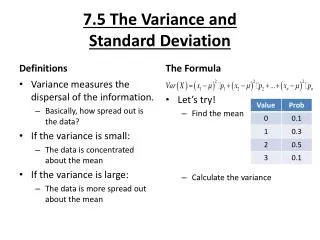
Mean 78.4 Median 77 Mode 99 Give the mean, median, and mode
Standard deviation 14.8 Variance 218.1 Give the standard deviation and variance
Below are the algebra test scores for a class of 25 students:
Below are the algebra test scores for a class of 25 students:
Mean 78.4 Median 79 Mode 82 Standard deviation 9.8 Variance 95.2 Mean 78.4 Median 77 Mode 99 Standard deviation 14.8 Variance 218.1 Give the mean, median, and mode. Give the standard deviation and varianceClass 1 Class 2
Range 99-56 43 Class Width 43 6 7 1/6 → 8 Give range and class width
Construct a frequency table and a cumulative frequency table with 6 classes
Construct a frequency table and a cumulative frequency table with 6 classes
Construct a frequency table and a cumulative frequency table with 6 classes
Construct a frequency table and a cumulative frequency table with 6 classes
Construct a histogram. Clearly mark axes. F r e q u e n c y Test Scores
Give all class marks. 56 + 63 2 59.5 64 + 71 2 67.5 59.5 67.5 75.5 83.5 91.5 99.5 Go to frequency polygon at the top of the next page of notes.
Construct a frequency polygon, mark axes F r e q u e n c y Test Scores
Construct an ogive. Clearly mark both axes R C F e u r l m e a u q t l u i a e v t n e i c v y e Test Scores