Download
1 / 18
190 likes | 302 Views
“Reflections on the Human Development Index” (paper by J. Foster) Additional Considerations Michaela Saisana michaela.saisana@jrc.ec.europa.eu European Commission Joint Research Centre Econometrics and Applied Statistics Unit. Introduction. Achievements The challenge The measure

E N D
“Reflections on the Human Development Index” (paper by J. Foster) Additional Considerations Michaela Saisana michaela.saisana@jrc.ec.europa.eu European CommissionJoint Research Centre Econometrics and Applied Statistics Unit
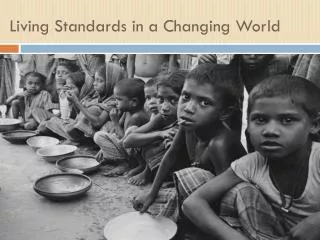
Introduction Achievements The challenge The measure Popularity ~5-fold increase since 2000 “Yet the dimensions of the HDI do not easily meld into one. And without a systematic method […prices…] the index could prove difficult to explain and defend” (J. Foster, 2013) It is exactly the “unobserved” nature of composite indicators that is their main limitation and their raison d'être.
Calibration Goalposts Gaterories Cobb-Douglas HDI Main points
Calibration Goalposts Categories Aggregation New HDI Main points “Frequent recalibration gives the strong suggestion that HDI values are contingent and temporary and depend importantly on arbitrary constructs” Foster’s suggestion: 1) ~ 10 year recalibration (as for poverty) 2) Crossover between calibration periods: process outlined explicitly and transparently Source: Global Innovation Index
Calibration Goalposts Categories Cobb-Douglas HDI Main points “The HDI is typically cast and interpreted as a multidimensional measure of size and hence is seen to be an absolute measure. […] Yet in actual implementation, this is not necessarily the way the HDI behaves.” Source: Wikipedia Life expectancy at birth Bounds in the HDI After 2010: 20y – observed (83.2 y, JN) Before : 25y – 85y
Calibration Goalposts Categories Cobb-Douglas HDI Main points Minimum and Maximum across 194 countries 85.6 Life expectancy at birth Suggestion: Fixed bounds 30y (Early 20th Century) – 87 years Similarly for the other indicators
Calibration Goalposts Categories Cobb-Douglas HDI Main points • Categories of Human Development • Relative (since 2010) versus Absolute (before 2010) • + progress against other countries, rather than arbitrary numerical cutoffs whose meaning may vary with each new calibration. • fuzzy incentives, less practical value for the country • many factors enter into the determination of progress (e.g. different calibrations, performance of other countries, policies of the country, or inclusion of new countries). • a country can not set a meaningful numerical target to achieve over time. • Foster’s suggestion: • 1) A staggered recalibration schedule & • 2) Fixed numerical cutoffs for the four HD categories (e.g. WB grouping by income)
Main points Further recommendation: To present the fixed cutoffs for the HDI with respect to the raw data (assuming an even performance) • Calibration • Goalposts • Categories • Cobb-Douglas HDI
Main points Calibration Goalposts Categories Cobb-Douglas HDI “[…] attempt to view the HDI more as a social evaluation function that aggregates across dimensional variables directly” L= life expectancy - 20 years E =1/2 (mean years of schooling + expected years of schooling) Y= ln (GNI per capita) – ln (100) W*= target social evaluation level
More on the geometric mean in the case of the HDI… Advantages of the geometric mean versus the arithmetic mean for the HDI 1) implies only partial compensability, i.e. poor performance in one HD dimension cannot be fully compensated by good performance in another, 2) rewards balance by penalizing uneven performance between dimensions, 3) encourages improvements in the weak dimensions, i.e. the lower the performance in a particular HD dimension, the more urgent it becomes to improve in that dimension.
More on the “quality” of the HDI… (Implicit Weights) We suggest to use as a measure of importance of a variable in an index what is known as: ‐ Pearson’s correlation ratio ‐ First order effect ‐ Top marginal variance - Main effect … HDI Life Expectancy Using these points we can compute a statistics that tells us: How much (on average) would the variance of the HDI scores be reduced if one could fix “Life expectancy”? Source: Paruolo, Saisana, Saltelli, 2013, J.Royal Stat. Society A
More on the “quality” of the HDI… (Implicit Weights) HDI Life Expectancy We could reduce the variation of the HDI scores by 83% by fixing ‘Life expectancy”. Quality check: The HDI is balanced in its three underlying dimensions (Si values are very similar)
More on the “quality” of the HDI… (Marginal weights) Marginal Weights= Recommendation: To plot life expectancy instead to evidence that countries with low life expectancy are more encouraged to improve
Tradeoffs = marginal rate of substitution, i.e. how much of one dimension must be given up for an extra unit of another, keeping the index constant. Some recent criticism… Previous HDI The new HDI has devalued longevity, especially in poor countries. Source: M. Ravallion (2012) Troubling tradeoffs in the HDI, J. Dev. Economics, 99:201-209
Final considerations Simply take the log of GNI just once (now logged twice) Take the arithmetic average the two education indicators (now geometric) Use two indicators per dimension (now only in case of education) Use the generalized mean of the three dimensions (a compromise solution between arithmetic-geometric averaging)
Assess any new calibration formula in terms of: Implicit weights (reduction in the HDI variance by fixing one dimension at a time) Marginal weights (impact on HDI of 1% increase in one of the dimensions) Marginal rate of substitution (how much of one component must be given up for an extra unit of another, keeping the index constant) More reading at: http://composite-indicators.jrc.ec.europa.eu (first Google hit on “composite indicators” over the last 10 years!)
References and Related Reading Paruolo P., Saisana M., Saltelli A., 2013, Ratings and Rankings: voodoo or science?. J Royal Statistical Society A176(2). Saisana M., Saltelli A., 2012, JRC audit on the 2012 WJP Rule of Law Index, In Agrast, M., Botero, J., Martinez, J., Ponce, A., & Pratt, C. WJP Rule of Law Index® 2012. Washington, D.C.: The World Justice Project. Saisana M., Philippas D., 2012, Sustainable Society Index (SSI): Taking societies’ pulse along social, environmental and economic issues, EUR 25578, Joint Research Centre, Publications Office of the European Union, Italy. Saisana M., D’Hombres B., Saltelli A., 2011, Rickety Numbers: Volatility of university rankings and policy implications. Research Policy 40, 165–177. Saisana M., Saltelli A., Tarantola S., 2005, Uncertainty and sensitivity analysis techniques as tools for the analysis and validation of composite indicators. J Royal Statistical Society A168(2), 307-323. OECD/JRC, 2008, Handbook on Constructing Composite Indicators. Methodology and user Guide, OECD Publishing, ISBN 978-92-64-04345-9.