Download
1 / 8
80 likes | 85 Views
TABLE 6.1. IDENTIFICATION OF BUSINESS RISKS. TABLE 6.2. RISK EVENTS CAUSING A DROP OF OVER 25 PERCENT IN FORTUNE 1000 STOCKS, 1993-1998. TABLE 6.3. OVERLAP OF TRADITIONAL AND ETHICS RISK/STAKEHOLDER INTERESTS ASSESSMENT APPROACHES. FIGURE 6.1.

E N D
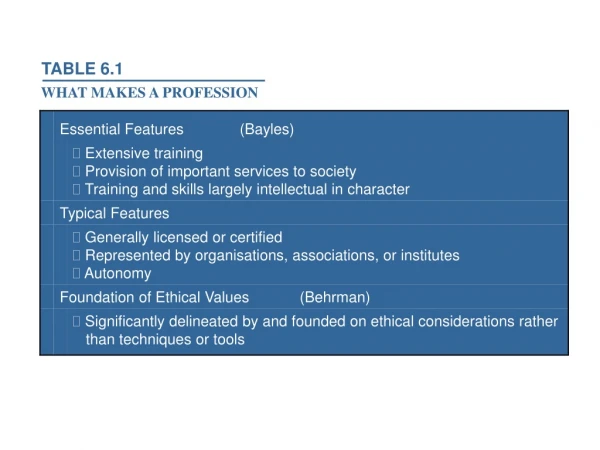
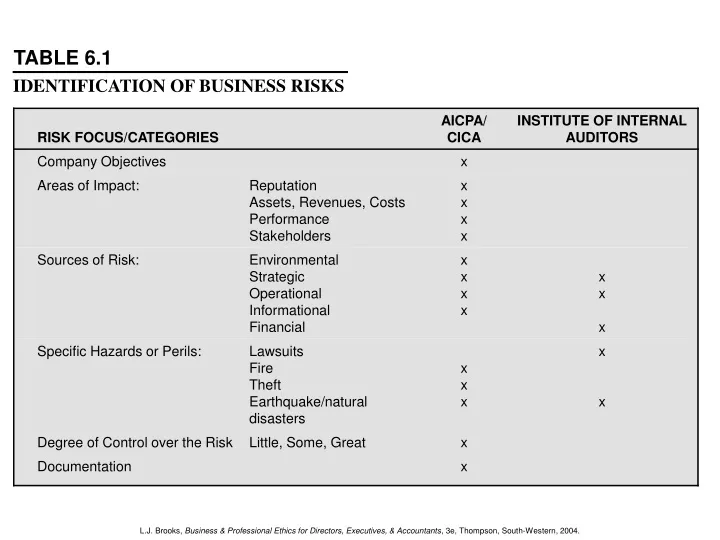
TABLE 6.1 IDENTIFICATION OF BUSINESS RISKS
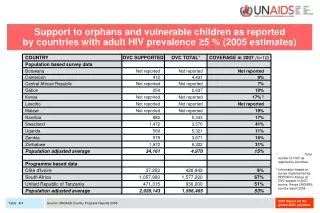
TABLE 6.2 RISK EVENTS CAUSING A DROP OF OVER 25 PERCENT IN FORTUNE 1000 STOCKS, 1993-1998
TABLE 6.3 OVERLAP OF TRADITIONAL AND ETHICS RISK/STAKEHOLDER INTERESTS ASSESSMENT APPROACHES
FIGURE 6.1 ETHICS RISK AND OPPORTUNITY IDENTIFICATION AND ASSESSMENT Phase 1 Develop a projected, ranked understanding of stakeholder interests/ expectations Phase 2 Compare activities to expectations to identify ethics risks & opportunities • Phase 3 • Reports by • Stakeholder group • Product or service • Corporate objective • Hypernorm value • Reputation driver Reputation Driver: Trustworthiness, credibility, reliability, responsibility Identify Confirmation Hypernorm: Honesty, fairness, compassion, integrity, predictability, responsibility Rank: Urgency, power, legitimacy Dynamic analysis Performance: Inputs, outputs, quality
FIGURE 6.2 DIAGNOSTIC TYPOLOGY OF ORGANIZATIONAL STAKEHOLDERS Stakeholder’s Potential for Threat High Low Type 4 Mixed Blessing Type 1 Supportive High Strategy Collaborate Strategy Involve Stakeholder’s Potential For Cooperation Type3 Nonsupportive Type 2 Marginal Low Strategy Defend Strategy Monitor SOURCE: G. Savage et al, “Strategies for assessing and managing organizational shareholders”, The Executive, Vol. 5, no. 2, May 1991, 65.
TABLE 6.4 EMPLOYEE RIGHTS THEMES IN NORTH AMERICA
FIGURE 6.3 PHASES OF A CRISIS Unanticipated Crisis Anticipated Crisis CostTo Organization ContinuingReputationalImapct Post-CrisisState Reached ControlBegins Time Controlled Phases Pre-crisis ReputationRestoration Uncontrolled
TABLE 6.5 HOW TO INCORPORATE ETHICS INTO CRISIS MANAGEMENT