Download
1 / 36
360 likes | 365 Views
Explore the problem of accessing and visualizing earth science data using traditional websites and discover the solution of using web services and virtual globes. Learn about the different web services and standards available for earth science data sharing and visualization.

E N D
Sharing and visualizing earth science data with Web Services and Virtual Globes Jon Blower (with help from lots of others!) Reading e-Science Centre Environmental Systems Science Centre University of Reading United Kingdom
The Problem discover analyse visualize lots of software packages! WHAT GOES HERE? lots of file formats! access control
Solution 1: Web interfaces to datasets Separate websites for each data provider
What’s wrong with Solution 1? • Discovery relies on web search and “just knowing it’s there” • Hard to intercompare data from different sites • Slow route to visualization: • Download data file(s) • Import into your tool of choice • Produce image • Can’t download subsets or aggregations of files • Different login for each provider • In summary: not very flexible! • All this is because websites are designed for humans, not machines
Solution 2: Web Services Different user interfaces for different user communities ? Web Services Web Services Web Services
More about Solution 2 • Each data provider provides “hooks” into the data store • Discovery: results = find_data(“salinity”) • Download: data = get_data(“temperature”, “North Atlantic”, “June 2006”, “NetCDF”) • Visualize: picture = get_map(“currents”, “global”, “2007-05-05”, “PNG”) • These “hooks” are Web Services • Third-party systems can use Web Services as plug-ins • Different user interfaces can be built on top of the same system • Much more flexible than Solution 1
A closer look at Web Services • Designed for machine-to-machine interaction • They are “subroutines” that run on remote machines • Data and messages are exchanged in platform-independent formats • Serve data to another system • with one notable exception (see later) • Can be made to be secure • You can do anything with Web Services! • BUT to be useful, communities must agree on standards for compatibility
So the question becomes… Different user interfaces for different user communities ? WHAT EXACTLY GOES HERE?
Some standard Web Services for earth science data • OPeNDAP (Open-source Project for a Network Data Access Protocol): • formerly known as DODS • allows clients to download data subsets • aggregates files into a single, logical whole • clients can treat remote data sets just like local ones • well supported by software tools and libraries • but requires clients to have advance knowledge of the data structure • Open Geospatial Consortium (OGC): • Whole suite of Web Services for different situations • Provides a logical and semantic view of the data • Tooling support less than OPeNDAP but growing quickly
OGC implementations • GeoServer • MapServer (U of Minnesota) • Deegree • ncWMS (for NetCDF data) • Lots of commercial stuff…
Standards give interoperability! NASA World Wind Cadcorp SIS Google Earth Geo-website
Web Services in Action:UK NERC Data Grid (NDG) • Provides access to atmospheric and oceanographic datasets produced by NERC projects • Each data provider installs a suite of Web Services • nothing is centralized! • Clients can use the NDG web interface or build their own interfaces • NDG allows: • discovery of data • online visualization of data • exploration of metadata • download of data http://ndg.nerc.ac.uk
Web Map Service (WMS) in Action:online data visualization • “Godiva2” website gives very fast previews of 4-D data on an interactive website • Reads data from NetCDF files and OPeNDAP servers • Serves images through an "enhanced" WMS • Draggable, zoomable map • Allows the fast creation of animations http://lovejoy.nerc-essc.ac.uk:8080/ncWMS/godiva2.html
Selection of depth Select from all the depth levels of the model
Selection of time (range) Select from all the timesteps in the model Selection of a time range leads to an animation
Finding the data value at a point Click on the data layer, data value and precise position is shown Lon: -64.08 Lat: 36.21 Value: 19.27
Timeseries plots If a time range is selected, can create a timeseries plot at a point
Godiva2 architecture Data sources NetCDF NetCDF Non-standard file format OPeNDAP WMS GIS client Virtual Globe Web interface
Web Services: conclusions • Web sites can be excellent, but are "dead ends" for data • You can't build on top of a website • Exposing data and metadata via Web Services allows: • Building of new interfaces on top of your data • Data from different locations to be brought together • OGC standards are part of the story • They handle the "geospatial" component of data • Need separate web services for other things like vocab, property databases • Web Services should be standards-compliant or simple (or both!) • WS and standards are no good without tools • Many providers now see more traffic through Web Services than their primary web site!
How can we bridge the gap? KML For humans For machines PDF or Web site (text + images) Web Service Paper Open end for data Dead end for data
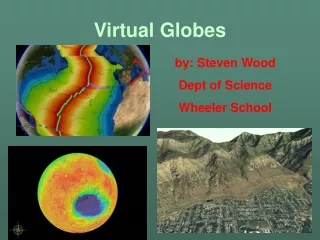
Virtual Globes • Easy to use 3-D applications for visualizing environmental data • All scales from global to sub-metre • Around 30 currently in existence! • Google Earth • NASA World Wind • ArcGIS Explorer • ... • Can combine data from numerous sources • Enable discovery of data • Use open standards • Simple data formats • Standard Web Services • Often free or low-cost • Generally can't do data analysis • Not replacements for fully-functional GIS systems! NSIDC Snow water equivalent in NASA World Wind
Keyhole Markup Language (KML) Balances simplicity with richness of representation Simpler than GML Richer than GeoRSS The format of Google Earth, but understood by many other systems: Google Maps NASA World Wind ArcGIS Explorer Other GIS software Encodes simple geographic features: Points, lines, polygons (e.g. in-situ observations) Image overlays (e.g. satellite images, model output) Can annotate features with more information E.g. links to website Can easily be created from existing data (Excel, databases…) Now on the standards track through OGC
Quick comparison of 3 Virtual Globes • Google Earth • Aimed at "the man in the street" • Easy to use • Poor support for OGC services • Big community • NASA World Wind • Aimed at scientists • Portal to NASA satellite imagery • Next version will be exciting (pluggable, customizable) • ArcGIS Explorer • Aimed at GIS community (esp. existing Arc users) • Can display subsurface and submarine data • Can write plug-ins in .NET • Very young
Virtual Globe strengths and weaknesses • Strengths • Easy to use • Easy to visualize data from different sources • Provide "lightweight GIS" format: KML • Low cost • Some support for discovery through VG interface • Weaknesses • Poor direct support for OGC services (WMS support patchy, WCS/WFS support almost non-existent) • Many historical GIS formats (shapefiles) not usually supported • Hard to visualize subsurface/submarine data
Google Earth and Web Services • Poor native support for OGC web services • BUT can link with a website that generates KML dynamically • Perhaps with data sourced from OGC services • Some OGC implementations have KML as a direct output format • Creative use of KML can lead to sophisticated systems! • (We are preparing a community website for people to share tips on VGs and geo-web)
Communication of scientific phenomena • Hurricane Katrina, August 2005 • Picture left shows sea surface temperature (UK Met Office) and storm position/intensity (TRACK analysis of ECMWF data) • Winds cause upwelling of cooler subsurface water on right-hand side of the cyclonic storm track • (much more obvious in live system!)
Highlighting of risks • Eruption of Cleveland volcano modelled by PUFF (Alaska VO) • 4-D simulation of ash cloud • Represented in KML • Can be animated in Google Earth • Could overlay with real-time aeroplane tracks for basic risk assessment
Monitoring an observing system • BODC use Google Earth as spatial metadata browsing tool for in-situ measurements • Can easily check for errors • E.g. Ocean data located on land • Misplaced component of linear ship track • Displays “light” metadata, with link to more sophisticated information • Developed in under a week!
Direction of missions with real-time data • British Antarctic Survey (BAS) used Google Earth to direct 2 scientific cruises in 2006 • Multiple data streams (ship location, sea temp and salinity, air temp and pressure) streamed to Google Earth in near real time • Combined with info about wider environment • Enabled real-time decision-making (e.g. tracking of predators, left) King penguin track overlain with concurrent chlorophyll and satellite imagery
Diagnosis of models and observations • Picture left shows comparison of NEMO model and observations for Nov 2004 • Red dots show bad model-obs fits, green dots are good fits • Google Earth allows very efficient browsing of these large datasets • Could read obs and model data from different sources and bring together in Google Earth or another client
Search and Rescue • ESSC and BMT Cordah • Use Google Earth as common platform for visualizing: • Oceanographic numerical model output data • SAR predictions • Drives improvements to both models.
Conclusions • Web Services avoid data "dead ends" • HTML and static images (websites) are "dead ends" • Web Services and GML are "open ends" • KML, SVG are somewhere in between • Serving data "the right way" allows new science to be done! • Interoperability permits intercomparison • Fast route to visualization (WMS, KML) • (The best technical solution is not always the most popular with users!) • Virtual Globes provide an easy way to drive collaborative work: • Quick intercomparison of data • Data discovery • ... but can never be the whole story
Some recommended web searches • "REST vs SOAP" : different approaches to Web Services • "OpenLayers" : open-source alternative to Google Maps • "KML tutorial" : (esp. NetworkLinks…) • "NASA World Wind" : open-source alternative to Google Earth • "ArcGIS Explorer" : ESRI virtual globe (free) • "GeoRSS" : Simple georeferencing (KML-lite)
Limitations of Virtual Globes • Large variability among VG applications. Generally: • Only basic support for OGC Web Services • Lack of support for subsurface and submarine data • Picture on right shows a workaround • No data analysis functions • But can link with Web Services and websites to do this • Most do not support GIS file formats (shapefiles, GeoTIFFs) • Need to do a conversion 3-D Gulf Stream shown above ground in Google Earth