Download
1 / 21
210 likes | 280 Views
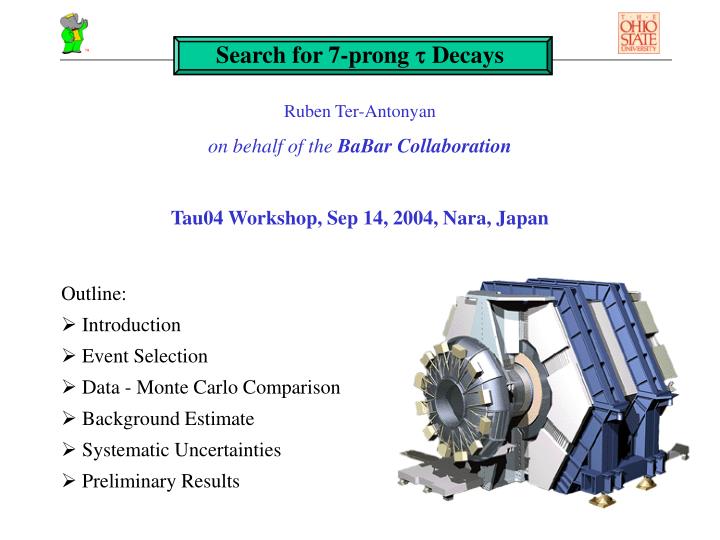
Search for 7-prong Decays. Ruben Ter-Antonyan on behalf of the BaBar Collaboration Tau04 Workshop, Sep 14, 2004, Nara, Japan. Outline: Introduction Event Selection Data - Monte Carlo Comparison Background Estimate Systematic Uncertainties Preliminary Results.

E N D
Search for 7-prong Decays Ruben Ter-Antonyan on behalf of the BaBar Collaboration Tau04 Workshop, Sep 14, 2004, Nara, Japan Outline: • Introduction • Event Selection • Data - Monte Carlo Comparison • Background Estimate • Systematic Uncertainties • Preliminary Results
BaBar and Physics 1.5 T Solenoid Electromagnetic Calorimeter (EMC) Detector of Internally Recflected Cherenkov Light (DIRC) e+ (3.1 GeV) PEP-II Delivered 253 fb-1 BaBar Recorded 244 fb-1 e- (9 GeV) Drift Chamber (DCH) Instrumented Flux Return (IFR) Silicon Vertex Tracker (SVT) BaBar is a great place for t physics! • s(e+ e- t+ t-) = 0.89 nb at 10.58 GeV • Recorded luminosity: 244 fb-1 220 million t pairs! • Analyzed luminosity:124.3 fb-1 110 million t pairs
7-prong t decays Very rare – no observation to date. e+ ttag • Experiment: • BR(t 7p(p0)nt )< 2.4 10-6 • (CLEO, 1997, PRD 56, 5297) • Theory: • BR(t 7p(p0)nt ) < 6 10-11 (assuming no substructure) • (S. Nussinov, M. Purohit, 2002, PRD 65) • Motivation: • With 25 times CLEO’s statistics we hope for a first observation • More stringent bound on the t neutrino mass if the decay is observed • Search for possible substructure in decay products. trec e- MC 1-7 event 1-prong side 7-prong side
MC Studies of Signal and Background • Signal 7p(p0)nt: • generated using phase space • Background: • generic t: -- generated using TAUOLA - biggest contribution from 5pp0ntmode (g - conversions) • hadronic: uds, cc, bb -- continuum qq simulated with JETSET • Bhabha, m-pair, 2-photon: negligible BABAR preliminary Mass (GeV/c2) Signal region Analysis proceeds “blinded”: events below 2 GeV/c2 are removed from the data.
Pseudo-Mass MC 7-prong Invariant and Pseudo-Mass • Pseudo-mass was introduced by ARGUS in 1992 to measure the t-lepton mass. • Assume neutrino is mass-less and takes zero energy • t direction is approximated by 7 ch. tracks • m*t2=2(Ebeam – E7p)(E7p – P7p)+m7p2 BABAR preliminary Events / 0.005 GeV/c2 Mass (GeV/c2) Advantage of pseudo-mass: • Sharp cut-off at the t mass (1.777 GeV/c2). • significant improvement of signal-background separation BABAR preliminary BABAR preliminary Events / 0.01 GeV/c2 Events / 0.01 GeV/c2 BR=2.4×10⁻⁶ All plots on this slide show Monte Carlo simulated events Invariant Mass (GeV/c2) Pseudo-Mass (GeV/c2)
Event Selection • Pre-Selection: • Up to 10 charged tracks and 12 neutrals in event • Thrust magnitude > 0.90 • Reject g-conversions • Select 8 “good” tracks in event: • distance of closest approach to the beam spot in XY-plane DOCAXY < 1.5 cm • distance of closest approach to the beam spot in Z-plane DOCAZ < 10 cm • 5 tracks with ≥12 drift chamber hits and transverse momentum pT >100 MeV/c • Topology cut: event is divided into two hemispheres perpendicular to thrust axis with 1 “good” track recoiling against 7“good” tracks and zero net charge • Event and 7-prong cuts: • Thrust magnitude > 0.93 • Particle ID for p-mesons • pT >100 MeV/c • DOCAXY / pT < 0.7cmc/GeV 1-prong tags: electron ID + 0 or 1g muon ID + 0 or 1g r, 0g h,0g 1.3 < Pseudo-Mass (7-prong) < 1.8 GeV/c2
Data-MC comparison • Quantitative disagreement between data and MC throughout the analysis • Data after all cuts contain 5 times larger sample of qq events than MC simulation predicts MC simulated qq events will not be used for bkg. estimate in data. BABAR preliminary Events / 0.025 GeV/c2 signal region Pseudo-Mass (GeV/c2) • Both data and MC have smooth pseudo-mass distributions • Both can be fitted with a Gaussian function MC simulated qq events will be used as a check of bkg. estimate method. MC qq is scaled to data qq above 2 GeV/c2. Background from t events is small and is determined from MC. Data above 2 GeV/c2 will be used to estimate qq bkg. in signal region
Background Estimate Scenario DATA After thrust cut DATA After all cuts fit BABAR preliminary m, s Events / 0.025 GeV/c2 Events / 0.025 GeV/c2 extrapolate integrate Pseudo-Mass (GeV/c2) Pseudo-Mass (GeV/c2) BABAR preliminary Mean • Fit from 2 to 2.5 GeV/c2 after thrust cut with a Gaussian function • Extrapolate the fit below 2 GeV/c2 • Integrate from 1.3 to 1.8 GeV/c2 Sigma • Use these fit parameters on the pseudo-mass spectrum after all cuts. Mean and sigma do not vary significantly after thrust cut. thrust cut Cuts
Background Estimate Validation: MC Pre-selection Thrust cut • MC Hadronic Bkg. (75 fb-1) • Pseudo-mass is fitted after thrust cut and fit parameters are used for bkg. estimate after each cut. • Good agreement between expected and observed number of bkg. events throughout the cuts. • After all cuts (1.3-1.8 GeV/c2): -- expected: 1.8 ± 0.7 -- observed: 1 7-prong p ID PT cut Events / 0.025 GeV/c2 DOCAXY/ PT cut 1-prong tags BABAR preliminary Pseudo-Mass (GeV/c2) Pseudo-Mass (GeV/c2)
Background Estimate Validation: 1-8 data 1-8 Data after thrust cut 1-8 Data after all cuts BABAR preliminary BABAR preliminary Events / 0.025 GeV/c2 Events / 0.025 GeV/c2 Pseudo-Mass (GeV/c2) Pseudo-Mass (GeV/c2) • 1-8 Topology Data. (91 fb-1) • Pure hadronic bkg. • Good agreement between expected and observed number of bkg. events in the signal region throughout the cuts. B A B A Rp r e l i m i n a r y
Preliminary Results After thrust cut After all cuts BABAR preliminary BABAR preliminary Events / 0.025 GeV/c2 Events / 0.025 GeV/c2 extrapolation of fit signal region Pseudo-Mass (GeV/c2) Pseudo-Mass (GeV/c2) Signal efficiency: -- 7pnt mode: 8.05% -- 7pp0ntmode: 8.04% Events in signal region -- expected bkg.: 11.9 ± 2.2 -- observed: 7 No evidence for signal !
Systematic Uncertainties Signal Efficiency (both modes have equivalent uncertainties) Tracking efficiency 5.2 % Particle ID 2.7 % 1-prong generic t BR 0.5 % Limited MC statistics 2.6 % Luminosity and t+t- cross-section 2.3 % tbackground Limited t MC statistics (3 events out of 621 fb-1) 58 % 5pp0nt branching ratio 15 % qq background Fit parameters (%) 18 % Fit range (%) 3 % Num. events fitted (%) 4 % Total uncertainty of signal efficiency (%) 6.8% B A B A R p r e l i m i n a r y Total uncertainty of t background (%) 60% Total uncertainty of qq background (%) 19%
Preliminary Upper Limit N t+t- 1.1 × 10⁸ t+t- background 0.6 ± 0.4 qq background 11.3 ± 2.2 Total expected background 11.9 ± 2.2 t- 4p- 3p+ nt efficiency (8.05 ± 0.55) % t- 4p- 3p+ p0 nt efficiency (8.04 ± 0.55) % B A B A R p r e l i m i n a r y using most conservative Bayesian approach BR (t- 4p- 3p+ (p0)nt ) @ 90% CL < 2.7 × 10⁻⁷ Experiment CLEO (1997) BaBar Luminosity (fb-1) 4.6 124.3 Observed (predicted) events 0 (2.8) 7 (11.9) BR (t- 4p- 3p+ (p0)nt ) @ 90% CL < 2.4 × 10⁻⁶ < 2.7 × 10⁻⁷
Summary • Pseudo-mass is a powerful tool for reducing qq background in the signal region • Hadronic background estimate completely done from data • No evidence for t- 4p- 3p+ (p0) nt found; BR upper limit is 10 times better than previously set • Will finalize the analysis with doubled statistics soon.
1-7 Topology Event A typical example of a MC simulated 1-7 event: on the left plot 8 tracks are counted, but the right plot shows where the 1 additional track comes from.
Looper and Photon Conversion Rejection • Looper candidate: • A pair of tracks with SVT hits • pT,LAB < 200 MeV/c for each track • |cosLAB| < 0.18 for each track • |DpT,LAB| < 100 MeV/c Remove tracks with largest DOCAZ • Photon Conversion candidate: • A pair of tracks with invariant mass < 5 MeV • Distance between tracks in XY-plane < 0.2 cm
Efficiency of the Cuts Events in signal region8.1% 8.3% 0 0 1.6 0 BABAR preliminary • After pre-selection background is always dominated by qq events. • 7-prong cuts suppress the background from generic t events. • Background from qq is suppressed after tagging the 1-prong and the pseudo-mass cut.
Data-MC Comparison Data/MC ratio for various topologies • Quantitative data-MC disagreement increasing with cuts for multi-prong events. • Domination of qq bkg. in multi-prong events, resulting in worse data-MC agreement. MC simulation of qq in 1-7 topology does not agree with data. • MC simulation of t events is reliable for an estimate. 85 68 3.8 0.59 0.37 BABAR preliminary 0.03 Numbers show MC simulated qq/t ratio for different topologies.
Background Estimate Validation • 1-7 MC: expected and observed qq bkg. in the region (1.3-1.8) GeV/c2 • 1-8 Data: expected and observed events in the region (1.3-2.0) GeV/c2 • 1-7 Data: expected background (t and qq) in the region (1.3-1.8) GeV/c2 -- t bkg. is estimated using Monte Carlo simulation -- qq bkg. is estimated from the fits Cuts1-7 MC1-8 Data1-7 Data exp. obs. exp. obs. exp. obs. Thrust mag. 89 ± 34 9541 ± 10 57 257 ± 36 298 7-prong p ID 33 ± 11 29 29 ± 7 32 108 ± 18 98 7-prong pT 22 ± 8 23 19 ± 5 22 83 ± 14 79 DOCAXY/pT 10 ± 4 15 7.7 ± 2.3 8 47 ± 9 40 1-prong tag 1.8 ± 0.7 1 2.0 ± 0.6 1 11.9 ± 2.2 7 B A B A R p r e l i m i n a r y The agreement is quite good!
Upper Limit Calculation with Errors To obtain the BR upper limit calculation incorporating uncertainties, we integrate the Likelihood function of the experiment: n – number of events observed, sampled from Poisson, m= <n> = f B + b b - number of bkg. expected, b* sample from normal N(b, sb) f = 2 Ntt e, f* sample from normal N(f, sf)