Download
1 / 18
180 likes | 187 Views
Water Rates and Affordability Revisited. J.M. Chermak J.K. Hansen Professor and Chair Assistant Professor Department of Economics DRMI University of New Mexico Naval Postgraduate School. NM Finance Infrastructure Conference Taos, NM October 23. 2012.

E N D
Water Rates and Affordability Revisited J.M. Chermak J.K. Hansen Professor and Chair Assistant Professor Department of Economics DRMI University of New Mexico Naval Postgraduate School NM Finance Infrastructure Conference Taos, NM October 23. 2012
Outline • Infrastructure Needs • Current Rates Expenditures • Comparisons • Rate Increases
Infrastructure Needs • EPA: US $334.8 billion (2007 $) for 2007* • 84% non-regulatory • 61% transmission; 6% source; 21% treatment • 36% of $ to large community systems (100,000 or larger) • 45% of $ to medium community systems • 19% in $ to small systems (3,300 or fewer) * Compared o $200 billion (2007 $) in 1995 From http://water.epa.gov/infrastructure/drinkingwater/dwns/upload/2009_03_26_needssurvey _2007_report_needssurvey_2007.pdf (Last accessed 10/22/2012).
NM Infrastructure Needs • NM (partial survey) $933 million (2007 $) • Doesn’t include medium size (59 systems) • Majority ($687 million) in small systems • In 2003 complete survey, needs were $1.1 billion. • Given increases in other states, there is a strong probability • That total needs are in excess of the 2003 number
NM Drinking Water Infrastructure Graded ASCE issued 2012 report card for drinking water Infrastructure on Sept 21, 2012: Capacity: C Condition: D+ Funding: D+ O&M: D+ Public Safety: C Resilience: C+ AVERAGE: C- From http://engr.nmsu.edu/pdfs/12_Infrastructure%20Report%20Card.pdf (Last accessed 10/22/2012)
Current Rates and Expenditure in NM For 6000 gallons per month By Size Municipality Small: $25.80 ($10 - $69) Municipality Medium: $23.87 ($9 - $42) System: $43.33 ($2 - $66) In 2005, the range was from $21 – 26 From: NMED 2012 Water and Sewer Rates Survey
Current Rates and Expenditure in NM For 6000 gallons per month By Location North: $28.91 ($15 - $69) Average HH Income $34.7K Mid: $27.37 ($14 - $51) Average HH Income $41.7K South: $22.23 ($9 - 49) Average HH Income $34.3K From: US Census Bureau (SAIPE)
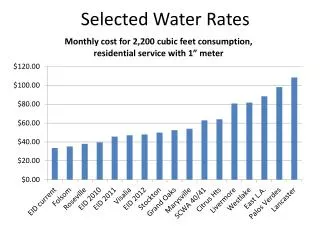
Comparisons to Adjacent States Colorado Front Range: $22a Arizona 19 Communities: $33b Texas TML Survey: $29c a From http://www.pueblowater.org/media/files/AnnualWaterChargeComparison_2010.pdf b From http://johnsonutilities.com/Rate%20Comparison.pdf C From http://www.tml.org/surveys.asp#water (All last accessed 10/22/2012)
Comparisons to Other Average Expendituresa Medium Municipality Water Bill: $24 Electric Bill (EIA): $74 Gasoline (4.8% of income): $150 Groceries (7% of income): $220 Dining Out (5.4% of income) $170 a Based on a household size of 2.9. From: http://www.creditloan.com/infographics/how-the-average-consumer-spends-their-paycheck/
Comparisons to Select Beverages Milk (4.9 gallons/HH/month): $14 Carbonated Beverage (10.8 gallons/HH/month): $40 Beer (3.5 gallons/HH/month): $24 Wine ( 0.4 gallons/HH/month) $20 Bottled Water (6.84 gallons/HH/month) $52 6000 gallons of water: ~$24 From: http://www.creditloan.com/infographics/how-the-average-consumer-spends-their-paycheck/ http://www.huffingtonpost.com/2011/06/27/americans-soda-beer_n_885340.html (Last accessed 10/22/2012)
If rates were to increased to fund infrastructure: What is affordable? In 2005, TX consumers paid 1.77% of income for 6000 gallons of water per month. While New Mexicans paid about 0.77%. Increasing to 1.77% would have increased Monthly expenditures to $43. Today we’re at ~$24. What does $11 buy?
If rates were to increased how would consumers react? Water fairly inelastic. The percentage change in quantity would be smaller than the percentage change in price. The longer the customer has to adjust the more elastic demand will become
Strategic Directions in the US Water Utility Industry Cost Factors “A major challenge for water utilities is that 85.4 percent of industry respondents believe that the average consumer has little to no understanding of the gap between the cost of producing safe water and current rates.” …. “… 50% of respondents feel that customers will probably be willing to pay higher rates needed to address infrastructure needs….” Black and Veatch (2012)
But in a recent survey: • Customers were willing to pay • $0.75 more per month to avoid the average length of outage increasing by one hour • $0.78 more per month to avoid one more outage in home over the next five years • Between $7.81 - $12.54 per month to avoid water pipe failures that resulted in five outages over five years • Based on a sample of 10,400 with an average response rate of 47.9% Thacher et al (2011). Assessing Customer Preferences and Willingness to Pay: A Handbook for Water Utilities. Water Research Foundation.
Actual Outcome? • Depends on (among other things): • Demographics • Design • Time to Adjust