Download
1 / 21
210 likes | 218 Views
Performance Evaluation of S3D using TAU. Sameer Shende tau-team@cs.uoregon.edu. Acknowledgements. Alan Morris [UO] Kevin Huck [UO] Allen D. Malony [UO] Kenneth Roche [ORNL] Bronis R. de Supinski [LLNL] The performance data presented here is available at:

E N D
Performance Evaluation of S3D using TAU Sameer Shende tau-team@cs.uoregon.edu
Acknowledgements • Alan Morris [UO] • Kevin Huck [UO] • Allen D. Malony [UO] • Kenneth Roche [ORNL] • Bronis R. de Supinski [LLNL] The performance data presented here is available at: http://www.cs.uoregon.edu/research/tau/s3d
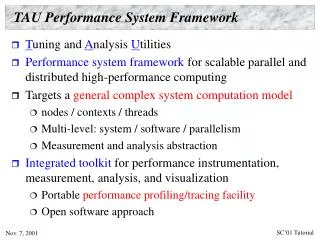
TAU Parallel Performance System • http://www.cs.uoregon.edu/research/tau/ • Multi-level performance instrumentation • Multi-language automatic source instrumentation • Flexible and configurable performance measurement • Widely-ported parallel performance profiling system • Computer system architectures and operating systems • Different programming languages and compilers • Support for multiple parallel programming paradigms • Multi-threading, message passing, mixed-mode, hybrid
Scalability Study • Harness testcase • Platform: Jaguar Cray XT3 at ORNL • 1728p • 8000p • Goal: to identify nodes with poor performance • Scalability of MPI operations
Using MPICH_RANK_REORDER_METHOD=1 • Inclusive time • increases! • 512p
Using MPICH_RANK_REORDER_METHOD=1 • MPI_Wait time • increases! • 512p
Scatter Plot - Axes and Color 6400p Two processors have low MPI_Wait times!
Scatter Plot - Axes and Color 1728 p Two processors do something different!
Second run 1728p shows one cpu in blue The variation (20.99s to 95s) is not as much in this run
MetaData MPI Processor name nid1194
8000p Two slow processors - Time • Running the 8000p job with metadata next. Job is waiting in queue.
S3D - Building with TAU • Change name of compiler in build/make.XT3 • ftn=> tau_f90.sh • cc => tau_cc.sh • Set compile time environment variables • setenv TAU_MAKEFILE /spin/proj/perc/TOOLS/tau_latest/xt3/lib/ Makefile.tau-callpath-multiplecounters-mpi-papi-pdt-pgi • Choose callpath, PAPI counters, MPI profiling, PDT for source instrumentation • setenv TAU_OPTIONS ‘-optTauSelectFile=select.tau -optPreProcess’ • Selective instrumentation file eliminates instrumentation in lightweight routines • Pre-process Fortran source code using cpp before compiling • Set runtime environment variables for instrumentation control and event PAPI counter selection in job submission script: • export TAU_THROTTLE=1 • export COUNTER1 GET_TIME_OF_DAY • export COUNTER2 PAPI_FP_INS • export COUNTER3 PAPI_L1_DCM • export COUNTER4 PAPI_RES_STL • export COUNTER5 PAPI_L2_DCM
Selective Instrumentation in TAU % cat select.tau BEGIN_EXCLUDE_LIST MCADIF GETRATES TRANSPORT_M::MCAVIS_NEW MCEDIF MCACON CKYTCP THERMCHEM_M::MIXCP THERMCHEM_M::MIXENTH THERMCHEM_M::GIBBSENRG_ALL_DIMT CKRHOY MCEVAL4 THERMCHEM_M::HIS THERMCHEM_M::CPS THERMCHEM_M::ENTROPY END_EXCLUDE_LIST BEGIN_INSTRUMENT_SECTION loops routine="#" END_INSTRUMENT_SECTION
Getting Access to TAU on Jaguar • set path=(/spin/proj/perc/TOOLS/tau_latest/x86_64/bin $path) • Choose Stub Makefiles (TAU_MAKEFILE env. var.) from /spin/proj/perc/TOOLS/tau_latest/xt3/lib/Makefile.* • Makefile.tau-mpi-pdt-pgi (flat profile) • Makefile.tau-mpi-pdt-pgi-trace (event trace, for use with Vampir) • Makefile.tau-callpath-mpi-pdt-pgi (single metric, callpath profile) • Binaries of S3D can be found in: • ~sameer/scratch/S3D-BINARIES • withtau • papi, multiplecounters, mpi, pdt, pgi options • without_tau
Concluding Discussion • Performance tools must be used effectively • More intelligent performance systems for productive use • Evolve to application-specific performance technology • Deal with scale by “full range” performance exploration • Autonomic and integrated tools • Knowledge-based and knowledge-driven process • Performance observation methods do not necessarily need to change in a fundamental sense • More automatically controlled and efficiently use • Develop next-generation tools and deliver to community • Open source with support by ParaTools, Inc. • http://www.cs.uoregon.edu/research/tau
Support Acknowledgements • Department of Energy (DOE) • Office of Science • LLNL, LANL, ORNL, ASC • PERI