Download
1 / 43
430 likes | 551 Views
Introduction to Statistics: Frequentist & Bayesian Approaches (for Non-Statisticians). Ryung Suh, MD Becker & Associates Consulting, Inc. Internal Staff Training June 8, 2004 ryung.suh@becker-consult.com. Objectives.

E N D
Introduction to Statistics: Frequentist & Bayesian Approaches (for Non-Statisticians) Ryung Suh, MD Becker & Associates Consulting, Inc. Internal Staff Training June 8, 2004 ryung.suh@becker-consult.com
Objectives • To provide a basic understanding of the terms and concepts that underlie statistical analyses of clinical trials data • To introduce Bayesian approaches and their application to FDA submissions BECKER, INC.
Table of Contents • Sources of Statistical Data • Frequentist Approaches • Bayesian Approaches • Insights from the Experts (from the Bayesian Approaches meeting, May 20-21, 2004) • Take-Aways and Strategic Insights • Corporate Resources BECKER, INC.
Sources of Data • Retrospective Studies: Design, Bias, Matching, Relative Risk, Odds Ratio • Prospective Studies: Design, Loss to Follow-up, Analysis, Relative Risk, Nonconcurrent Prospective Studies, Incidence, Prevalence • Randomized Controlled Trials: Design, Elimination of Bias, Placebo Effect, Analysis • Survival Analysis: Person-Time, Life-Tables, Proportional Hazard Models BECKER, INC.
Classical = Frequentist • Hypothesis Testing: In order to draw a valid statistical inference that an independent variable has a statistically significant effect (not the same as clinically significant effect), it is important to rule out chance or random variability as an explanation for the effects seen in a sampling distribution. BECKER, INC.
Statistical Inference • Two inferential techniques: • Hypothesis Testing • Confidence Intervals • Inference is the process of making statements (hypotheses) with a degree of statistical certainty about population parameters based on a sampling distribution BECKER, INC.
Hypothesis Testing: Terms • Null Hypothesis = Ho = initially held to be true unless proven otherwise • e.g. there is NO difference between treatment and control • e.g. µ = 11, or μ2 – μ1 = 0 • Akin to “the accused is innocent” • Alternative Hypothesis = Ha = is the claim we usually want to prove • e.g. there is a difference between treatment and control • e.g. µ ≠ 11, or μ2 – μ1 ≠ 0 • Akin to “the accused is guilty” • We assume innocence until proven guilty “beyond a reasonable doubt”… the same applies with Ho BECKER, INC.
Reality Ho is false Ho is true TYPE I ERROR No Error Reject Ho Decision TYPE II ERROR Fail to Reject Ho No Error Hypothesis Testing: Decisions • Decision Options: • Reject Ho (and assert Ha to be true) • Fail to Reject Ho (due to insufficient evidence) • Errors in Decisions: BECKER, INC.
Level of Significance • Alpha = α = P(Type I Error) = P(Reject Ho | Ho is true) • Beta = β = P(Type II Error) = P(Fail to Reject Ho | Ho is false) • Power = 1 – β • We want both α and β to be small… but increasing one decreases the other… This example is a simplification to aid understanding; the exact β tends to be generally unknown, although it is frequently due to sample sizes that are too small. Alternative Hypothesis Null Hypothesis BECKER, INC.
Sampling Distribution • Population Distribution: usu. a normal distribution with a mean of μ and a variance of σ2 (but tough to measure the entire population) • Sampling Distribution: a distribution of means from random samples drawn from the population; a random variable (Ẋ); normally distributed with a mean (μẊ) and variance of (σ2/n), • Take random samples from the population and calculate a statistic • Describes the chance fluctuations of the statistic and the variability of sample averages around the population mean, for a given sample size (n). • Sample mean (μẊ) serves as a point estimate for the population mean (μ) • Central Limit Theorem: as n ∞, sampling distribution approaches normal distribution (and the estimate becomes more precise) • http://www.ruf.rice.edu/~lane/stat_sim/sampling_dist/ BECKER, INC.
Determining the P(Ẋ=μ) • Key Question: Does the sample mean reflect the population mean, given the effects of variability/chance? • If population standard deviation (σ) is known, we can standardize (mean=0; s.d.=1) and compare: Z = (Ẋ - μẊ) / (σ / √n) • If σ is unknown, we can estimate σ from the same set of sample data and compare with a normal t-distribution: T = (Ẋ - μẊ) / (s / √n) • a continuous distribution symmetric about zero • an infinite number of t-distributions indexed by degrees of freedom • as degrees of freedom (n-1) increase, t-distributions approach standard normal distributions BECKER, INC.
Normal versus t-distribution N(0,1) T-distributions are “flatter” and have more area in the tails compared to Normal distributions T-distributions approximate the Normal as degrees of freedom (n-1) increase t(1) t(5) BECKER, INC.
Hypothesis Testing: More Terms • Test Statistic: the computed statistic used to make the decisions in hypothesis testing; relates to a probability distribution (e.g. Z, t, Χ2) • Critical Region: contains the values of the test statistic such that Ho is rejected • Critical Value: the endpoint(s) of the critical region • One-tailed versus two-tailed tests: depends on Ha • P-Value: the smallest value of α such that Ho will be rejected (a probability associated with the calculated value of the test statistic) BECKER, INC.
Steps in Hypothesis Testing:The Classical/Frequentist Approach • Define parameter and specify Ho and Ha • Specify n (sample size), α (significance level), the test statistic, and the critical value(s) and critical regions • Take a sample and compute the value of the test statistic; compare to the relevant probability distribution • Reject or fail to reject Ho and draw statistical inferences * Remember: P-value is not the probability of the null hypothesis being true (the null hypothesis is either true or not, with P-value defining the level of significance for which randomness is considered). BECKER, INC.
Confidence Intervals • CI for (1-α)100%: Ẋ ± t (n-1, α/2)(s/√n) • Provides CI for population mean (μ) at the chosen level of confidence (e.g. 90%, 95%, 99%) • Provides interval estimate of the population mean (vs. the point estimate that the sample mean gives) • Depends on the amount of variability in the data • Depends on the level of certainty we require • Increasing (1-α) will increase the CI width • Increasing sample size (n) will decrease the CI width BECKER, INC.
Issues for Frequentists (and others) • Multiplicity: the chance of a Type I error when multiple hypotheses are tested is larger than the chance of a Type I error in each hypothesis test • Multiple Endpoints: Frequentists worry about the dimensions of the sample space (the Bayesian looks at the dimensions of the parameter space)…both tend to be skeptical of “believing what he thinks he sees in high-dimensional problems” (Permutt) • Multiple Looks: Trials are expensive, so sequential methods are attractive; but stopping rules tend to be fixed in frequentist approaches • Multiple Studies: Frequentist meta-analysis (to look at combined evidence from several studies) cannot rely simply on a fixed p-value (i.e. 0.05); it must look at the entirely of the evidence and the strength of each piece • Garbage In, Garbage Out BECKER, INC.
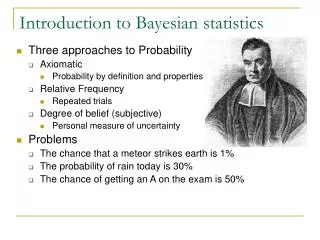
Bayesian Statistics • Thomas Bayes (1702-1761): English theologian and mathematician; “Essay towards solving a problem in the doctrine of chances” (1763) • Bayesian methods: iterative processes that make better decisions based on learning from experiences • combines a prior probability distribution for the states of nature with new sample information • the combined data gives a revised probability distribution about the states of nature, which is then used as a prior probability distribution with new (future) sample information • and so on and so on • Key feature: using an empirically derived probability distribution for a population parameter • May use objective data or subjective opinions in specifying a prior distribution • Criticized for lack of objectivity in specifying prior probability distribution BECKER, INC.
A Bayesian example • From http://www.abelard.org/briefings/bayes.htm • 15 blue taxis; 85 black taxis; only 100 taxis in the entire town • Witness claims seeing a blue taxi in hit-and-run • Witness is given a “random” ordered test • successfully identifies 4/5 taxis correctly (80%) • “If witness claims blue, how likely is she to have the color correct?” • Blue taxis: 80% is 12 blue; 3 black • Black taxis: 80% is 68 black; 17 blue • In given sample space, 12/29 claims of “blue” are actually blue taxis (41%) • A claim of “black” would be 68/71 (in the given sample space) = 96% • Bayesians take into account the rate of “false positives” for black taxis as well as for blue taxis (note that black taxis are in greater supply here) • Bayesian stats useful for calculating relatively small risks (e.g. rare disorders) • Bayesian stats useful in non-random distributions BECKER, INC.
Perspectives on Probability • Frequentist: probability = the relative frequency of an event, given the experiment is repeated an infinite number of times • Bayesian: probability = “degree of belief” or the likelihood of an event happening given what is known about the population BECKER, INC.
Bayesian Hypothesis Testing • Non-Bayesians: navigate the optimal tradeoff between the probabilities of a “false alarm” (Type I error) and a “miss” (Type II error) • One can compare the likelihood ratio of these two probabilities to a nonnegative threshold value (or the log likelihood ratio to an arbitrary real threshold value) • Increasing the threshold makes the test less “sensitive” (higher chance of a “miss”); decreasing the threshold makes the test more sensitive (but with a higher chance of a “false alarm”) • More data improves the limits of this ratio (the limit relation is often give as Stein’s lemma, which approaches the Kullback-Leibler distance) • Bayesians: instead of optimizing a probability tradeoff, a “miss” event or “false alarm” event is assigned costs; additionally, we have prior distributions • Decision function is based on the Bayes Risk, or expected costs • Threshold value is a function of costs and priors BECKER, INC.
Bayesian Parameter Estimation • Non-Bayesians: the probability of an event is estimated as the empirical frequency of the event in a data sample • Bayesians: include empirical “prior information;” as the data sample goes to infinity, the effects of the past trial wash out • If there is no empirical “prior information,” it is possible to create a prior distribution based on reasonable beliefs • We calculate the posterior distribution from the sample data and the prior distribution using Baye’s Theorem: P(A|B) = [ P(B|A) * P(A) ]/ P(B) • This becomes the new prior distribution (known as a conjugate prior); this process allows efficient sequential updating of the posterior distributions as the study proceeds • The “output” of the Bayesian analysis is the entire posterior distribution (not just a single point estimate); it summarizes ALL our information to date • As we get more data, the posterior distribution will become more sharply peaked about a single value BECKER, INC.
Bayesian Sequential Analysis • Given no fixed number of observations, and the observations come in sequence (until we decide to stop)… • Non-Bayesians: the sequential probability ratio test is comparable to the log likelihood ratio and is used to decide on outcome 1, outcome 2, or to keep collecting observations (assigning threshold values to the log ratio functions) • Bayesians: use the sequential Bayes risk by assigning a cost (of “false alarms” and “misses”) proportional to the number of observations prior to stopping; the goal is to minimize expected cost using a strategy of optimal stopping BECKER, INC.
Steve Goodman (Hopkins) • Medical Inference is inductive • Deductive (disease signs/symptoms)… traditional statistical methods • Inductive (signs/symptoms disease)…Bayesian approaches more appropriate • Bayes Theorem: • prior odds x Bayes factor = posterior odds • Pretest odds x likelihood factor = posttest odds • P-Value = P(X being more extreme than observed result, assuming null hypothesis to be true) • Does not represent the probability of observed data being true • Does not represent the probability of observed data being by chance • Does not represent the probability of the truth of the null hypothesis • If P(data|hypothesis) = p, then likelihood of (hypothesis|data) = c*p, where c is an arbitrary constant • P(H0|data) / P(Ha|data) = [g / (1-g)] * [P(data|H0) / P (data|Ha)] BECKER, INC.
P-Value: Noncomparative Observed + hypothetical data Implicit Ha Evidence can only be negative Sensitive to stopping rules No formal interpretation Bayes Factor: Comparative Only observed data Pre-defined explicit Ha Positive or negative evidence Insensitive to stopping rules Formal interpretation Steve Goodman (Hopkins) P-Value asks you to look at the data only then make inferences later Bayesian methods ask you to ask the question first and look at existing data that is evidence for the question BECKER, INC.
Tom Louis (Hopkins) • Bayesian Inference: • Specify the multi-level structure of prior probability distributions • Compute the joint posterior distribution for all unknowns • Compute the posterior distribution of quantities by integrating known conditions • Use the joint distribution to make inferences • Bayesian Advantages: • Precision increases with more available information • Repeated sampling gives information on the prior • More flexible when looking at partially related gaussian distributions • Allows inclusion and structuring of historical data (allows a compromise between ignoring historical data (no weight) and data-pooling (full weight) • Captures relevant uncertainties • Structures complicated inferences • Adds flexibility in designs • Documents assumptions BECKER, INC.
Don Berry (M.D. Anderson) • Approaches to drug/device development: • Fully Bayes likelihood principle (for company decision-making) • Bayesian tools for expanding the frequentist envelope (for designing and analyzing registration studies) • Bayesian advantages: • Sequential learning is useful in study design • Predictive distributions (frequentists cannot emulate this) • Borrowing strength from historical data, concomitant trials, or from across patient and disease groups • Early data allows Adaptive Randomization • Ethical advantage: stop clearly harmful or ineffective drugs/devices early in the trial • Find “nuggets” quickly and with higher probability • Learn quickly, treat patients in trial more effectively, save resources • May save resources (base development on early decision-analysis) • May test multiple experimental drugs (e.g. cancer drug cocktails) • Seamless transitions through clinical trial phases (e.g. do not stop accrual) • Increase statistical power with much smaller sample populations • Relates response and survival rates as well • Early decisions on treatment…and on ending a trial… BECKER, INC.
Bob Temple (CDER) • FDA is “nervous” and “inexperienced” with regard to Bayesian analysis (perhaps with exception in CRDH) • Strategy: should show both frequentist and Bayesian results (and show the difference) • Pitfalls: Bayesian approaches can sometimes be longer and more expensive for the company • Bottomline: Bayesian approaches are still new and need to be better understood by investigators and regulators BECKER, INC.
Larry Kessler (CDRH) • Bayesians at CDRH: Greg Campbell, Don Malec, Gene Pennello, Telba Irony • White Paper (1997): http://ftp.isds.duke.edu/WorkingPapers/97-21.ps • Applications to devices: • Devices tend to have a great deal of prior information (mechanism of action is physical and local, as opposed to pharmacokinetic and systemic) • Devices usually evolve in small steps • Studies “gain strength” by using quantitative prior information • Prediction models available for surrogate variables • Sensitivity analysis available for missing data • Adaptive trial designs often useful for decision theoretics, non-inferiority trials, and post-market surveillance • Helps determine sample size and interim-look strategies • Risks and Challenges: • Often a trade-off between “clinical burden” and “computational burden” • Can be more expensive (e.g. if the prior information is NOT predictive or useless) • Beware of the “regression to the mean” effect • Hierarchical structure is not good if too little (single prior study) or too much prior info BECKER, INC.
Larry Kessler (CDRH) • Considerations: • Restrict to quantitative prior information • Need legal permission because companies tend to “own” prior studies and data • Published literature and SSEs often lack patient-level data • FDA/companies need to reach agreement on the validity of any prior info • Need new decision rules for the clinical study process • Frequentist: statistically significant result for primary endpoint effectiveness • Bayesian: posterior probability exceeding some predetermined value (or some interval within which it behaves consistently) • Bayesian trials must be prospectively designed (no switching mid-stream) • Control group cannot be used as a source of prior info for the new device • Need new formats for Labeling and for the Summary of Safety and Effectiveness • Simulations are important (show that “Type I error” is well-controlled) • FDA review team plays role in choice of decision rules for success and for the exchangeability of prior studies in a hierarchical model • Recommendations: • Prospectively planned, with legally available and valid prior information • Good communications with the FDA, with a good statistician, and proper electronic Data BECKER, INC.
Ralph D’Agostino (Boston Univ)(Advisory Committee Member) • Randomized Controlled Trials: need to keep simple • Challenge is that Bayesian methods can sometimes seem complex • Promise is that Bayesian methods can be made more intuitive • Should NOT use Bayesian methods to salvage studies that have failed frequentist approaches • Sometimes Bayesians are too optimistic about their ability to see validity across studies with different populations, different endpoints, and different analytical methods BECKER, INC.
Bob O’Neill (CDER) • Too many people misinterpret the p-value • We rely on statistical significance with little regard for effect size or magnitude • The FDA needs to develop more format and content guides about reporting Bayesian statistics • Dealing with missing data is essentially a Bayesian exercise (i.e. model-building) • Bayesian statistics cut both ways (may require more time, expenses, and data to reach required evidence) BECKER, INC.
Stacy Lindborg (Global Statistics) and Greg Campbell (CDRH) • SL: Need validated computer software for Bayesian statistics and need a great deal of education to help regulators and clinicians understand the meaning of “predictive posterior probabilities” and to trust in Bayesian statistics • SL: Great promise with regard to: • Looking at data more comprehensively • Conducting trials more ethically • GC: Bayesian designs need to be done prospectively • CANNOT switch to Bayesian analysis to rescue/salvage studies that are not going well • GC: Bayesian methods have the potential to shorten study duration, cut costs (by reducing number of patients), and enhance product development • GC: Between 1999-2003, there have been 14 original PMAs & Supplements in which Bayesian estimation was the primary analysis; many more are in the works BECKER, INC.
Don Rubin (Harvard) and Jay Siegal (Centecor) • DR: Bayesian thinking is our natural way to look at the world • DR: Frequentist approaches need to work with Bayesian thinking (they are still just rules) • DR: Validation is needed to ensure that both the model and the analysis are appropriate • JS: Bayesian approaches (which relies on Predictive Value) and Frequentist approaches (which relies on Specificity) will converge to the extent that prior probabilites are similar • e.g. in adult use drugs/devices now applied to pediatric use • e.g the same class of drug being applied to similar therapeutic uses • JS: Concerns about movement toward Bayesian approaches • Shifts incentives toward non-innovative (more valid priors for existing therapies) • Priors constantly change during a trial (need predictable, prospective standards) • Legal concerns about using competitors’ data BECKER, INC.
Susan Ellenberg (OBE, CBER) and Norris Alderson (FDA) • SE: If Bayesian approaches are really a better mousetrap, it will spread and people will “beg” to demand it • NA: “Bayesian is NOT a religion” • NA: Incorporating a priori knowledge is useful, but we need frequentist checks at times (reality checks) • NA: Clear guidelines on methods, formats, content, analysis, etc. are need; FDA regulators will need to work with statisticians, clinicians, and industry to accomplish this • NA: Bayesian approaches still must deal with the common sources of bias found in frequentist approaches BECKER, INC.
Statistical Terms and Concepts • Sources of Data • Statistical Inference • Frequentist Hypothesis Testing • Null and Alternative Hypotheses • Test Statistics and Sampling Distribution • Type I and Type II Errors; Power • P-Value and Significance Level (α) • Confidence Intervals • Bayesian Statistics • Prior probability distribution • Posterior (or Joint) probability distribution • Bayes Factor (or Likelihood Ratio) • Adaptive Randomization BECKER, INC.
Strategic FDA Insights • FDA (especially CDRH) favorable to Bayesian approaches • Not effective in rescuing/salvaging troubled studies; must do prospectively • May lead to quicker, less expensive approvals (but may be longer, more expensive as well) • Useful in predictive models, sensitivity analysis for missing data, adaptive trial designs, and for looking at data more comprehensively (and perhaps ethically) • Need to use valid quantitative prior information (work with owners of data and with the FDA) • New decision rules, content, format, method, analysis, and reporting guidelines are needed (as well as new labeling and SSE) • A good statistician with both Bayesian and Frequentist credentials is perhaps our best advocate; many Bayesians already have good relationships with the FDA BECKER, INC.
Final Thoughts • Clinical versus Statistical Significance • Why p-values of 0.05? • Importance of the research question • Bayesian is not a religion, although some Bayesians seem to see it that way • The promise of new statistical approaches • Our need to understand (at least at a basic level) the statistical work we do for our clients BECKER, INC.
Corporate Resources • Carlos Alzola, MS • Aldo Crossa, MS • Campbell Tuskey, MSPH • Reine Lea Speed, MPH • Ryung Suh, MD • Expert Associates: Simon, d’Agostino, Rubin, HCRI, Hopkins • Firm Library and Statistical Literature BECKER, INC.
References • “Bayesian Approaches,” U.S. Food and Drug Administration. Meeting at Masur Auditorium, National Institutes of Health, May 20-21, 2004. • Morton, Richard F, J. Richard Hebel, and Robert J. McCarter. A Study Guide to Epidemiology and Biostatistics. 3rd ed. 1990. • Permutt, Thomas. “Three Nonproblems in the Frequentist Approach to Clinical Trials,” U.S. Food and Drug Administration. • Stockburger, David W. Introductory Statistics: Concepts, Models, and Applications. http://www.psychstat.smsu.edu/introbook/sbk19m.htm • Thornburg, Harvey. “Introduction to Bayesian Statistics,” CCRMA. Stanford University, Spring 2000-2001. • Sampling Distribution Demonstration. http://www.ruf.rice.edu/~lane/stat_sim/sampling_dist/ BECKER, INC.