Download
1 / 33
350 likes | 598 Views
Protein Function Prediction from Protein Interactions. Limsoon Wong. Rule-based system for processing free texts in scientific abstracts Specialized in extracting protein names extracting protein-protein interactions. PPI Extraction: The Dream. Jak1. PIP Extraction: Challenges.

E N D
Protein Function Predictionfrom Protein Interactions Limsoon Wong
Rule-based system for processing free texts in scientific abstracts Specialized in extracting protein names extracting protein-protein interactions PPI Extraction: The Dream Jak1
Question:After we have spent so much effort dealing with this monster, what can we use the resulting interaction networks for?
Some Answers • Someone else’s work: • Guide engineering of bacteria strains to optimize production of specific metabolites • Detect common regulators or targets of differentially expressed genes, even when these are not on the microarray • And many more … • Our own work: • Improve inference of protein function even when homology information is not available
Engineering E. coli for Polyhydroxyalkanoates Production Source: Park et al., Enzyme and Microbial Technology, 36:579-588, 2005
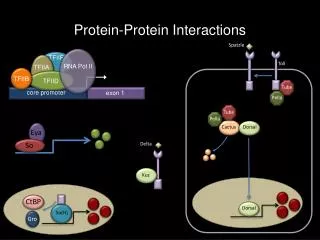
For example, shown here for the genes of interest (blue halo) are upstream regulators (green halo), and downstream targets (red halo). Pink oval represent genes, yellow boxes biological processes. Signaling Network Analysis for Detecting Regulators and Targets (even when these are not on the microarrays) Source: Miltenyi Biotec
Level-1 neighbour Level-2 neighbour Improve inference of protein function even when homology information is not available
Protein Function Prediction Approaches • Sequence alignment (e.g., BLAST) • Generative domain modeling (e.g., HMMPFAM) • Discriminative approaches (e.g., SVM-PAIRWISE) • Phylogenetic profiling • Subcellular co-localization (e.g., PROTFUN) • Gene expression co-relation • Protein-protein interaction • …
Neighbour counting (Schwikowski et al, 2000) Rank function based on freq in interaction partners Chi-square (Hishigaki et al, 2001) Chi square statistics using expected freq of functions in interaction partners Markov Random Fields (Deng et al, 2003; Letovsky et al, 2003) Belief propagation exploit unannotated proteins for prediction Simulated Annealing (Vazquez et al, 2003) Global optimization by simulated annealing Exploit unannotated proteins for prediction Clustering (Brun et al, 2003; Samanta et al, 2003) Functional distance derived from shared interaction partners Clusters based on functional distance represent proteins with similar functions Functional Flow (Nabieva et al, 2004) Assign reliability to various expt sources Function “flows” to neighbour based on reliability of interaction and “potential” Protein Interaction Based Approaches
Direct functional association: Interaction partners of a protein are likely to share functions w/ it Proteins from the same pathways are likely to interact Indirect functional association Proteins that share interaction partners with a protein may also likely to share functions w/ it Proteins that have common biochemical, physical properties and/or subcellular localization are likely to bind to the same proteins Level-1 neighbour Level-2 neighbour Functional Association Thru Interactions
SH3-Binding Proteins SH3 Proteins An illustrative Case of Indirect Functional Association? • Is indirect functional association plausible? • Is it found often in real interaction data? • Can it be used to improve protein function prediction from protein interaction data?
Materials • Protein interaction data from General Repository for Interaction Datasets (GRID) • Data from published large-scale interaction datasets and curated interactions from literature • 13,830 unique and 21,839 total interactions • Includes most interactions from the Biomolecular Interaction Network (BIND) and the Munich Information Center for Protein Sequences (MIPS) • Functional annotation (FunCat 2.0) from Compre-hensive Yeast Genome Database (CYGD) at MIPS • 473 Functional Classes in hierarchical order
Validation Methods • Informative Functional Classes • Adopted from Zhou et al, 1999 • Select functional classes w/ • at least 30 members • no child functional class w/ at least 30 members • Leave-One-Out Cross Validation • Each protein with annotated function is predicted using all other proteins in the dataset
59.2% proteins in dataset share some function with level-1 neighbours 27.9% share some function with level-2 neighbours but share no function with level-1 neighbours YAL012W |1.1.6.5 |1.1.9 YJR091C |1.3.16.1 |16.3.3 YMR300C |1.3.1 YPL149W |14.4 |20.9.13 |42.25 |14.7.11 YBR055C |11.4.3.1 YMR101C |42.1 YDR158W |1.1.6.5 |1.1.9 YPL088W |2.16 |1.1.9 YBR293W |16.19.3 |42.25 |1.1.3 |1.1.9 YBL072C |12.1.1 YLR140W YMR047C |11.4.2 |14.4 |16.7 |20.1.10 |20.1.21 |20.9.1 YBR023C |10.3.3 |32.1.3 |34.11.3.7 |42.1 |43.1.3.5 |43.1.3.9 |1.5.1.3.2 YBL061C |1.5.4 |10.3.3 |18.2.1.1 |32.1.3 |42.1 |43.1.3.5 |1.5.1.3.2 YLR330W |1.5.4 |34.11.3.7 |41.1.1 |43.1.3.5 |43.1.3.9 YKL006W |12.1.1 |16.3.3 YDL081C |12.1.1 YDR091C |1.4.1 |12.1.1 |12.4.1 |16.19.3 YPL013C |12.1.1 |42.16 YPL193W |12.1.1 YOR312C |12.1.1 Freq of Indirect Functional Association
Over-Rep of Functions in Neighbours • Functional Similarity: • where Fk is the set of functions of protein k • L1 ∩ L2 neighbours show greatest over-rep • L3 neighbours show no observable over-rep
Remove overlaps in level-1 and level-2 neighbours to study predictive power of “level-1 only” and “level-2 only” neighbours Sensitivity vs Precision analysis ni is no. of fn of protein i mi is no. of fn predicted for protein i ki is no. of fn predicted correctly for protein i “level-2 only” neighbours performs better L1 ∩ L2 neighbours has greatest prediction power Sensitivity vs Precision 1 L1 - L2 0.9 L2 - L1 0.8 L1 ∩ L2 0.7 0.6 Sensitivity 0.5 0.4 0.3 0.2 0.1 0 0 0.1 0.2 0.3 0.4 0.5 0.6 0.7 0.8 0.9 1 Precision Prediction Power By Majority Voting
Functional Similarity Estimate:Czekanowski-Dice Distance • Functional distance between two proteins (Brun et al, 2003) • Nk is the set of interacting partners of k • X Δ Y is symmetric diff betw two sets X and Y • Greater weight given to similarity • Similarity can be defined as Is this a good measure if u and v have very diff number of neighbours?
Functional Similarity Estimate:Modified Equiv Measure • Modified Equivalence measure • Nk is the set of interacting partners of k • Greater weight given to similarity • Rewriting this as
Correlation w/ Functional Similarity • Correlation betw functional similarity & estimates • Equiv measure slightly better in correlation w/ similarity for L1 & L2 neighbours
Use L1 & L2 Neighbours for Prediction • Weighted Average • Over-rep of functions in L1 and L2 neighbours • Each observation of L1 or L2 neighbour is summed • S(u,v) is equiv measure for u and v, • (k, x) = 1 if k has function x, 0 otherwise • Nk is the set of interacting partners of k • x is freq of function x in the dataset
Informative FCs 1 NC 0.9 Chi² 0.8 PRODISTIN 0.7 Weighted Avg 0.6 0.5 Sensitivity 0.4 0.3 0.2 0.1 0 0 0.1 0.2 0.3 0.4 0.5 0.6 0.7 0.8 0.9 1 Precision Performance Evaluation • LOOCV comparison with Neighbour Counting, Chi-Square, PRODISTIN
Cellular Role Biochemical Function SubCellular Location 1 1 1 NC NC 0.9 0.9 0.9 Chi² Chi² PRODISTIN PRODISTIN 0.8 0.8 0.8 MRF MRF FunctionalFlow FunctionalFlow 0.7 0.7 0.7 Weighted Avg Weighted Avg 0.6 0.6 0.6 NC Sensitivity Sensitivity Sensitivity 0.5 0.5 0.5 Chi² PRODISTIN 0.4 0.4 0.4 MRF FunctionalFlow 0.3 0.3 0.3 Weighted Avg 0.2 0.2 0.2 0.1 0.1 0.1 0 0 0 0 0.1 0.2 0.3 0.4 0.5 0.6 0.7 0.8 0.9 1 0 0.1 0.2 0.3 0.4 0.5 0.6 0.7 0.8 0.9 1 0 0.1 0.2 0.3 0.4 0.5 0.6 0.7 0.8 0.9 1 Precision Precision Precision Performance Evaluation • Dataset from Deng et al, 2003 • Gene Ontology (GO) Annotations • MIPS interaction dataset • Comparison w/ Neighbour Counting, Chi-Square, PRODISTIN, Markov Random Field, FunctionalFlow
Correct Predictions Correct Predictions Correct Predictictions vs Predictions Made - Cellular Role vs Predictions Made - SubCellular Location vs Predictions Made - Biochemical Function 1 1 1 0.9 0.9 0.9 0.8 0.8 0.8 0.7 0.7 0.7 0.6 0.6 0.6 Fraction Fraction Fraction 0.5 0.5 0.5 0.4 0.4 0.4 NC NC 0.3 0.3 0.3 NC Chi² Chi² Chi² PRODISTIN 0.2 PRODISTIN 0.2 0.2 PRODISTIN FunctionalFlow FunctionalFlow FunctionalFlow 0.1 Weighted Avg 0.1 0.1 Weighted Avg Weighted Avg 0 0 0 1 2 3 4 5 6 7 8 9 10 1 2 3 4 5 6 7 8 9 10 1 2 3 4 5 6 7 8 9 10 Predictions Predictions Predictions Performance Evaluation • Correct Predictions made on at least 1 function vs Number of predictions made per protein
Diff Expt Sources have diff reliabilities Assign reliability to an interaction based on its expt sources (Nabieva et al, 2004) Reliability betw u and v computed by: ri is reliability of expt source i, Eu,v is the set of expt sources in which interaction betw u and v is observed Reliability of Expt Sources
Integrating Reliability • Take reliability into consideration when computing Equiv Measure: • Nk is the set of interacting partners of k • ru,w is reliability weight of interaction betw u and v • Rewriting
Integrating Reliability • Equiv measure shows improved correlation w/ functional similarity when reliability of interactions is considered:
Informative FCs 1 NC 0.9 Chi² 0.8 PRODISTIN Weighted Avg 0.7 Weighted Avg R 0.6 Sensitivity 0.5 0.4 0.3 0.2 0.1 0 0 0.1 0.2 0.3 0.4 0.5 0.6 0.7 0.8 0.9 1 Precision Performance Evaluation • Prediction performance improves after incorporation of interaction reliability
PPI Interaction Data General Rep of Interaction Data 17815 Unique Pairs, 4914 Proteins Reliability: 0.366(Based on fraction with known functional similarity) Sequence Similarity Smithwaterman betw seq of all proteins For each seq, among all SW scores w/ all other seq, extract seq w/ SW score >= 3 standard deviations from mean 32028 Unique Pairs, 6766 Proteins Reliability: 0.659 Gene Expression Spellman w/ 77 timepoints Extract all pairs w/ Pearson’s > 0.7 11586 Unique Pairs, 2082 Proteins Reliability: 0.354 Incorporating Other Info Sources
Conclusions • Indirect functional association is plausible • It is found often in real interaction data • It can be used to improve protein function prediction from protein interaction data • It should be possible to incorporate interaction networks extracted by literature in the inference process within our framework for good benefit
Acknowledgements • Hon Nian Chua • Wing Kin Sung
References • Breitkreutz, B. J., Stark, C. and Tyers, N. (2003) The GRID: The General Repository for Interaction Datasets. Genome Biology, 4:R23 • Brun, C., Chevenet, F., Martin, D., Wojcik, J., Guenoche, A., Jacq, B. (2003) Functional classification of proteins for the prediction of cellular function from a protein-protein interaction network. Genome Biol. 5(1):R6 • Deng, M., Zhang, K., Mehta, S.Chen, T. and Sun, F. Z. (2003) Prediction of protein function using protein-protein interaction data. J. Comp. Biol. 10(6):947-960 • Hishigaki, H., Nakai, K., Ono, T., Tanigami, A., and Takagi, T. (2001) Assessment of prediction accuracy of protein function from protein-protein interaction data, Yeast, 18(6):523-531 • Lanckriet, G. R. G., Deng, M., Cristianini,, N., Jordan, M. I. and Noble, W. S. (2004) Kernel-based data fusion and its application to protein function prediction in yeast. Proc. Pacific Symposium on Biocomputing 2004. pp.300-311. • Letovsky, S. and Kasif, S. (2003) Predicting protein function from protein/protein interaction data: a probabilistic approach. Bioinformatics. 19(Suppl.1):i197–i204
References • Ruepp A., Zollner A., Maier D., Albermann K., Hani J., Mokrejs M., Tetko I., Guldener U., Mannhaupt G., Munsterkotter M., Mewes H.W. (2004) The FunCat, a functional annotation scheme for systematic classification of proteins from whole genomes. Nucleic Acids Res. 14:32(18):5539-45 • Samanta, M. P., Liang, S. (2003) Predicting protein functions from redundancies in large-scale protein interaction networks. Proc Natl. Acad. Sci. U S A. 100(22):12579-83 • Schwikowski, B., Uetz, P. and Fields, S. (2000) A network of interacting proteins in yeast. Nature Biotechnology 18(12):1257-1261 • Titz B., Schlesner M. and Uetz P. (2004) What do we learn from high-throughput protein interaction data? Expert Rev.Proteomics 1(1):111–121 • Vazquez, A., Flammi, A., Maritan, A. and Vespignani, A. (2003) Global protein function prediction from protein-protein interaction networks. Nature Biotechnology. 21(6):697-670 • Zhou, X., Kao, M. C., Wong, W. H. (2002) Transitive functional annotation by shortest-path analysis of gene expression data. Proc. Natl. Acad. Sci. U S A. 99(20):12783-88