Download
1 / 15
150 likes | 281 Views
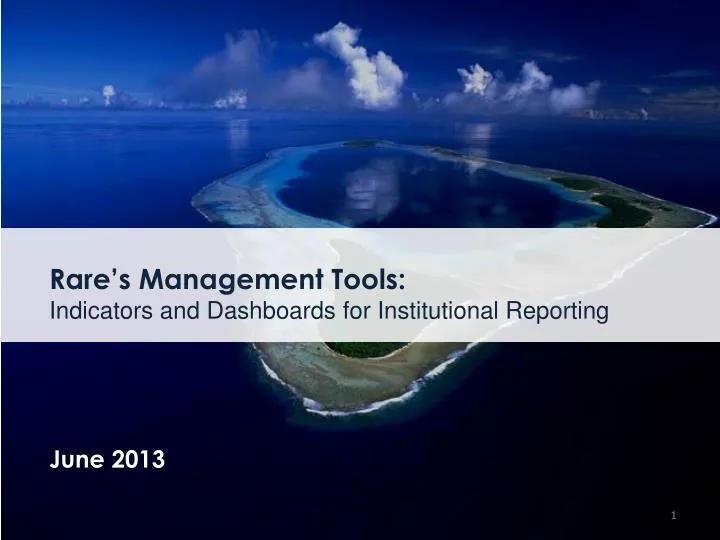
Rare’s Management Tools: Indicators and Dashboards for Institutional Reporting June 2013. Rare at a Glance. Founded : 1973 Central office: Arlington, VA, USA Regional offices: Indonesia, China, Mexico, Micronesia, Philippines Total staff globally: 120

E N D
Rare’s Management Tools: Indicators and Dashboards for Institutional Reporting June 2013
Rare at a Glance Founded:1973 Central office: Arlington, VA, USA Regional offices: Indonesia, China, Mexico, Micronesia, Philippines Total staff globally:120 # of countries Rare has worked in:56 Our specialty: Social marketing to reduce environmental threats. Method Summary: Rare trains partners to run “Pride campaigns” that change attitudes and behaviors, provide sustainable alternatives, and help communities protect biodiversity at the local level.
The Science of Behavior Meets the Science of Conservation Science of Conservation Science of Behavior
Measure Across the Program Campaign Sustainability A Pride campaign is a 2 -3 year project lead by local partners that creates opportunities for local communities to adopt new behaviors and reduce threats to biodiversity. Program Impact • At about ½ of sites: • Quantitative Social Survey • Follow up Biophysical Campaign Near-term • Assess actual vs. goals • Lessons learned Campaign Process • Quantitative Social Survey • Follow up Biophysical Campaign Baseline • Weekly Ops Reports • Monthly leading indicators Program Goals • Focus groups • Quantitative Social Survey • Baseline Biophysical • Social goals • Biophysical goals 2 years 3- 5 years 1 year
Rare’s Strategy Map The Strategy Map Defines the Processes that Support Our Mission
Balance Scorecard Cascades & Cross Cuts the Organization Rare Measures Most Strategic Cross-cutting Measures Priorities Information Departmental Measures Strategy & Ops Individual Measures Ops Supporting Strategy
The Balanced Scorecard Measures Progress on the Strategy Map • Summary • 18 measures across: • Programmatic Goals • Financial Capital Goals • Human Capital Goals • New process – surveys of partners and staff • Cascades • Organizational metrics (seen here) • Departmental metrics • Individual metrics • Implementation • Challenge has been organizational alignment and agreement, not technology • Built on Clearpoint by Ascendant Consulting • Web-based
Decision Structure Annual update sets new targets, refines measures and allows for some revisions CEO & COO • Sets strategy and priorities • Signs off on goals CEO & COO • Manage processes • Aligns groups • Quality assurance We moved this responsibility from Finance to Global Programs Sr. Director Global Programs Sr. Director Global Programs Divisional Heads • Align with global goals • Set divisional goals Divisional Heads • Ensure sound methodology • Align with key process • Ensure quality assurance Internal Experts
Measurement is integral to operations Pride Management Process Pride Campaign Execution Initial Planning 1 1 2 Select Theme Recruit & select Partners Program Management 3 Train & Support Partners Supporting Global Teams 1 Program Development Team • Manages the recruitment of partners • Helps select which partners and sites we should work with 2 Quality Management & Improvement • Helps set standards for all Pride campaigns • Monitors campaigns against set goals 3 • Designs training for programmatic staff • Creates training for our Pride campaign managers (partner staff) Global Programs
Since our programs last just 2 to 3 years we ensure measurement systems are in place • For lots of reasons we chose to time constrain our programs to a few years • However, during the campaign we can measure the process Quarterly Measure the Implementation of Monitoring Protocols
Build partner commitment for long-term monitoring • Set goals to measure impact after the program ends • Get partners that are committed to measure Track Long-term Commitment to Monitoring
Opportunities (Challenges) Ahead … Incorporate human wellbeing measures Longitudinal reporting More donor reporting More program types Joint reporting with partners Show impact and stay credible