Download
1 / 39
550 likes | 966 Views
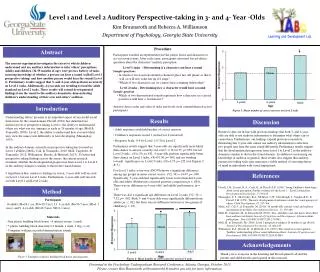
Auditory perception classes: critical bands/auditory filters. David Poeppel Questions/complaints/concerns: david.poeppel@nyu.edu.

E N D
Auditory perception classes:critical bands/auditory filters David Poeppel Questions/complaints/concerns: david.poeppel@nyu.edu
Coronal slice (structural MRI) illustrating localized activation in superior auditory cortex (upper bank of superior temporal gyrus) to sinusoidal tones of different frequencies. Coronal slice illustrating auditory pathway from ear to auditory cortex
Auditory system Kandel 2000
Frontal lobe 8a 46d 12vl 10, orb Temporal lobe Tpt STS TS1, 2 Parabelt CPB RPB Belt CL CM ML RM AL RTL RTM R RT Core A1 Thalamus MGv MGd MGm Sg/Lim PM ICp ICdc ICx Midbrain ICc VNLL Lateral lemniscus DNLL Sup. olivary complex LSO MSO MNTB AVCN PVCN DCN Contralateral cochlear n. Kaas & Hackett , PNAS 97, 11793 - 9 (2000)
Auditory cortex Auditory cortex Medial geniculate body Medial geniculate body Inferior colliculus Inferior colliculus Lateral lemniscus Lateral lemniscus Superior Olivary Complex Superior Olivary Complex Cochlear Nucleus Cochlear Nucleus Left Cochlea Right Cochlea Chandrasekaran & Kraus 2009
Functional anatomy of speech sound processing Hickok & Poeppel, 2007, Nat Rev Neurosci
A few reminders about the characteristics • Frequency range of human auditory system • 20 Hz to 20,000 Hz (textbook); 50 Hz to 10,000 Hz (really); most psychophysics is done between 100 - 5,000 Hz (because that is the range in which one obtains interpretable data). • Intensity range • Extends over many orders of magnitude (depending on frequency); at the ‘sweet spot’ (~1000-3000 Hz) about a 120 dB dynamic range • Sensitivity • JNDs for frequency: ~0.2% (e.g., at 1000 Hz base frequency, listeners can distinguish 1000 Hz from 1002 Hz -- impressive!) • JNDs for loudness discrimination: ~1 dB • Sensitivity to timing differences: a few microseconds in spatial hearing (JNDs for azimuthal localization ~1 deg); 2 milliseconds (gap thresholds); 25 milliseconds (order threshold). Really impressive …
Absolute threshold of hearing in quiet audiograms
Perceptual attributes of sounds • Spatial location • Binaural hearing (inter-aural time and intensity differences), head-related transfer function. • Loudness • Signal amplitude (ASA Demos 8-11, compare 6/3/1 dB steps) • Pitch • sound frequency, fundamental frequency of complex periodic signals, or inter-harmonic spacing • Timbre • Distribution of energy across frequency, shape of the spectrum The frequency resolution/processing of the system underlies the construction of perceptual attributes.
Pure vs. complex tones (all A440) - pitch, timbre, phase T (= 2.27 ms) t pitch is (largely) phase invariant
Cochlear animation, the Hudspeth version http://www.rockefeller.edu/labheads/hudspeth/movie06_popup.html
Masking • The interference one sound causes in the reception of another sound • Peripheral component/cause: overlapping excitation pattern • Central component/cause: uncertainty - “informational masking” • Masking experiments have been used extensively to investigate spectral and temporal aspects of hearing • Masking to study frequency selectivity: the critical band • Forward and backward masking (temporal and spectral constraints) • Comodulation masking release CMR (‘unmasking’ of sub-threshold signal by comodulated signal in different regime)
Determine threshold of sinusoidal signal in noise. Noise always centered at signal frequency. signal Sound level (dB) masker Frequency (Hz) Classic experiment: Fletcher 1940 Schooneveldt & Moore 1989 • ASA Demos 2-6 -- count tones in noise, as function of bandwidth. • Increases in noise bandwidth result in more noise passing through a given filter, yielding more masking. However, when the noise bandwidth exceeds the filter bandwidth, there is no more threshold change. The point at which further increases yield no further threshold in creases: critical band. • Starting with Fletcher, masking studies have been used to evaluate frequency selectivity of auditory system. • Interpretation of masking data: auditory periphery can be described as a set of contiguous, overlapping bandpass filters, with overlapping passbands. These “auditory filters” comprise the first stage in the spectro-temporal analysis of all sounds.
Critical bands by loudness comparison loudness frequency Zwicker & Feldtkeller 1967; Scharf 1970; Rossing 1982 Reference noise band compared to test noise band with increasing bandwidth (constant power). When the bandwidth of the test noise exceeds the critical bandwidth, the loudness begins to increase. (ASA Demo 7)
Model of masking: Power spectrum model The (peripheral) auditory system contains an array of linear overlapping bandpass filters. When detecting signal in noise, listener makes use of just one filter, centered close to the signal frequency. This filter will pass the signal but remove a great deal of the noise. Only the noise components passing through the filter will mask the signal. The threshold is determined by the amount of noise passing through the filter. The threshold corresponds to some signal-to-noise ratio K at the output of the filter. • Simplifying assumption made by Fletcher: rectangular filters, ‘flat top’, width of the filter is CB. • Estimate value of CB indirectly by measuring power of sinusoidal signal Ps required for detection in broadband white noise of power density N0. Noise falling within CB is N0 x CB. Following 4 above, Ps/(N0 x CB) = K CB = Ps/(N0 x K) By measuring Ps and N0 and estimating K, the value of the critical band can be determined. (Fletcher estimated K=1; Scharf, 1970, revised that to about 0.4) (Ps/N0 called ‘critical ratio’) Estimating the shape of the auditory filter based on power-spectrum model: Ps = K 0∞N(f) W(f) df • Masker is represented by its long-term power spectrum N(f) • Weighting function, or auditory filter is W(f) • Ps is power of the signal at threshold
Patterson’s ‘notched noise’ method To assess auditory filter shape, Roy Patterson developed a new masking approach. The signal is fixed in frequency and the masker is noise with a bandstop, the width of which is varied. Threshold corresponds to a constant signal-to-masker ratio at the output of the filter. Patterson, R.D. (1976). J. Acoust. Soc. Am., 59, 640-659.
Patterson’s ‘notched noise’ method Patterson, R.D. (1974). J. Acoust. Soc. Am., 55, 802-809.
Shape of auditory filter from notched noise Typical values of auditory filter bandwidth, based on notched-noise approach: 10-15% of center frequency. The auditory filter, unsurprisingly, is unlike a simple rectangular filter. This filter cannot be specified with a single number … However, some sort of summary statistic is useful. Common measure: bandwidth of the filter at the point at which the power has fallen by a factor of 2 -- i.e. by 3 dB. (Other measure: equivalent rectangular bandwidth (ERB)). Other approaches to characterizing the auditory filter: • psychophysical tuning curves (e.g. Vogten 1974) • rippled noise method (Glasberg, Moore, Nimmo-Smith 1984 )
Four approaches to study critical bands 1. Masking with noise on target 2. Critical bands by loudness 3. Notched noise method 4. Psychophysical tuning curves • A critical band CB is understood as a spectral window over which energy is integrated for certain tasks. • Spectral band filters, as observed in psychoacoustics and in behavioral experiments, are sliding spectral windows. • CB estimates in humans are ~0.14 - 0.23 octaves
The width of the critical band (auditory filter) changes with center frequency
The shape of the critical band (auditory filter) changes with signal amplitude
Relation between auditory filters and excitation pattern Top: 1-kHz sinusoid as ‘represented’ by five auditory filters, centered at different frequencies. Bottom: calculated excitation pattern of auditory system Moore & Glasberg 1983
Summary 1: The filter-bank model of hearing • The basilar membrane 'filters' parts of a sound into the auditory-nerve fibers, so that the output of the cochlea is like the output of a bank of filters that transmit information in parallel. • Each of these 'auditory' filters is centered at a different frequency, and responds to only a narrow range of frequencies. The centre frequencies of adjacent filters are very close, so that their frequency ranges overlap considerably. • There are around 25,000 nerve fibres in the auditory nerve, so the center frequencies of filters are, effectively, continuously distributed over the ear's frequency range.
basal end apical end Summary 2: critical bands/auditory filters 1. Human auditoryperceptual analysis is quantized into < 30 “critical bands” 2. of perceptually near-identical frequency analysis classes 3. corresponding to approximately equal length bands of cochlear tissue (receptor surface) Hall & Garcia, 2012
Co-modulation masking release (CMR) • Task: Detection of a pure tone embedded in noise • Stimuli: Target & 2 types of noise • 1) Gaussian white noise (UM) • 2) Amplitude-modulated noise (CM) • (Gaussian white noise x sinusoid) amplitude time Co-modulated temporal fluctuations across different frequency bands
Auditory CMR Stimuli presentation timeline & summary target = 750ms Target x 100 trials per condition per session x 3... ISI = 500ms mask = 1000ms ISI = 500ms Task: Detection of a pure tone embedded in noise Stimuli: Target masked by either UM or CM noise UM CM Each type of noise masker is filtered to have different bandwidths: typically: 50, 100, 200, 400, 1000, 2000 Hz (=12 blocks) centered at a given frequency (e.g., 1, 2 or 4 kHz) Measure: thresholds for detection of target in each noise condition using interleaved staircases (2x 1-up, 2-down), 50 trials per staircase Trials blocked by condition type
Co-modulation masking release (CMR) UM CM Critical Band width for 1 kHz Center Frequency First reported in: Hall, J.W., Haggard, M.P. & Fernandez, M.A. (1984). Detection by spectro-temporal pattern analysis. J. Acoust. Soc. Am. 76: 50-56.
Co-modulation masking release (CMR) Summary • Target detection is easier when the noise masker is amplitude co-modulated (CM) compared to the reference (UM) white noise condition. • The CMR effect increases with increasing bandwidth (counterintuitive...adding more noise reduces threshold!) • Proposed mechanisms (many): e.g., “the dip-listening hypothesis”
Co-modulation masking release (CMR) • The classical auditory CMR effect (typically run at 50Hz) can be obtained @ lower modulation frequencies...(extensive piloting done at 4Hz, 5Hz & 10Hz modulation frequencies). The above results are also reported in the literature: Bacon et al. (1997). Masking by modulated and unmodulated noise: effects of bandwidth, modulation rate, signal frequency, and masker level.
Spectral resolution is great. But do you always need it? Shannon 1995