Download
1 / 27
270 likes | 281 Views
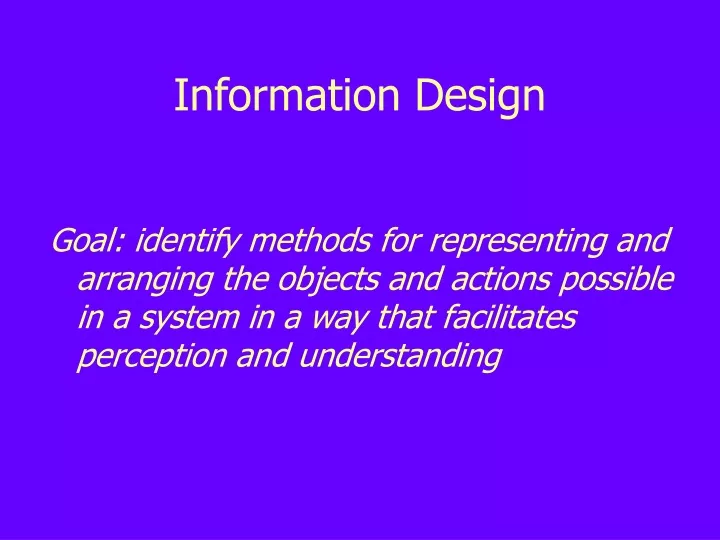
Information Design. Goal: identify methods for representing and arranging the objects and actions possible in a system in a way that facilitates perception and understanding. Information Design. Define and arrange the visual (and other modality) elements of a user interface

E N D
Information Design Goal: identify methods for representing and arranging the objects and actions possible in a system in a way that facilitates perception and understanding
Information Design • Define and arrange the visual (and other modality) elements of a user interface • Screen layout, icon design, vocabulary selection • But also the “big picture” or overall info model • Models of perception, psychology guide this • Engineering an information design • Make sure what people see (hear, etc.) makes sense, and helps them to pursue meaningful goals • Depends on what they are doing, hence the important role of user interaction scenarios
Interpretation Perception Making sense GULF OF EVALUATION Last month’s budget... ? GULF OF EXECUTION Execution System goal Action plan Stages of Action in HCI focus of information design focus of interaction design
Making Sense of an Information Display Interpretation Excel worksheet, a cell is selected, formula is displayed at top Making Sense Income worksheet, Total tax income is being calculated, the wrong multipler is being used Perception color, shading, lines characters, squares, spatial organization Last month’s budget... ?
Perception • Organize and encode sensory data in the mind • Lines, shapes, colors are “extracted” • Very fast, generally with no conscious thought • May be influenced by expectations, “top-down” • Low-level units then grouped and organized • Perceived as rows, columns, grids, figures • Seeing the relationships among different elements • Design goal: make this perceptual process rapid and accurate
Human Vision • Highest bandwidth sense (100 MB/sec) • Parallel processing • Pre-attentive • Pattern recognition • Extends memory and cognitive capacity • People think visually
Which state has highest income? • Relationship between income and education? • Outliers?
College Degree % Per Capita Income
How to Lie With Visual Displays • Only show data ranges that accentuate your argument (chop off bottoms) • Choose time spans appropriate for you • Compare logarithmic data on a non-logarithmic graph • Use multiple dimensions to show one-dimensional data • Change scale in the middle of your graph
How NOT to Lie With Visual Displays • Show meaningful data ranges • Choose representative time spans • Use appropriate scales in displaying information • Use dimensions in an appropriate manner • Maintain a common scale throughout your graph
Gestalt Principles of Perception Proximity Similarity Closure Area Symmetry Continuity
Gestalt in User Interface Design Try the “squint test”... What principles are in action?
Images: Realism and Refinement • Realistic images recognized more accurately, but are more complex, take longer to process • Analyze task carefully, remove unnecessary detail
Leveraging Familiarity • Choose a user interface “vocabulary” that people are used to reading or seeing • Display vs. Render; Copy vs. Reproduce • Document container icons are folders, not boxes • Caution: many familiar words are ambiguous • View, update, object, enter • 2nd caution: consider audience carefully • What is familiar to an adult may not be to a child; what is expected by one culture may be surprising to another Check out the many examples in the Interface Hall of Shame: http://www.iarchitect.com/
Tradeoffs: Designing for Perception • Task-relevant information versus complexity • Decompose tasks, link to less critical information • Offer visual distinctions, but not too many levels • Too many variations (e.g., different colors) will make the cues hard to discriminate, slowing perception Elegant designs exploit position, thematic repetition, low-key color schemes, and white space, instead of lines, boxes, and labels to organize information
Human Limitations for Short-Term Memory • Miller’s 7 +/- 2 magic number • People can recognize 7 +/- 2 chunks of information at a time and hold these chunks in memory for 15-30 seconds • Chunking • Ability to cluster information together • Size of chunk depends on knowledge, experience, and familiarity
Chunking Example 1 HEC ATR ANU PTH ETR EET
Chunking Example 2 THE CAT RAN UP THE TREE
Other Chunking Examples • Image sequences • Facial recognition • Word/letter familiarity • Hierarchies of information • Others?
Principles of Design • Provide a good conceptual model • How does it work? • What does it say to the user? (don’t lie!) • Leverage gestalt principles of perception • Proximity, similarity, closure, area, symmetry, continuity • Make things visible (leverage affordances) • What can user see/feel/grab/push? • What does it look like it will do?