Download
1 / 39
390 likes | 514 Views
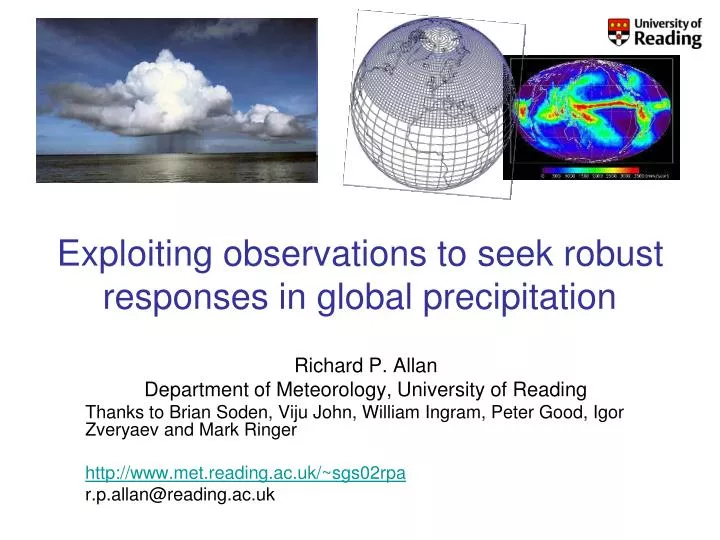
Exploiting observations to seek robust responses in global precipitation. Richard P. Allan Department of Meteorology, University of Reading Thanks to Brian Soden, Viju John, William Ingram, Peter Good, Igor Zveryaev and Mark Ringer http://www.met.reading.ac.uk/~sgs02rpa

E N D
Exploiting observations to seek robust responses in global precipitation Richard P. Allan Department of Meteorology, University of Reading Thanks to Brian Soden, Viju John, William Ingram, Peter Good, Igor Zveryaev and Mark Ringer http://www.met.reading.ac.uk/~sgs02rpa r.p.allan@reading.ac.uk
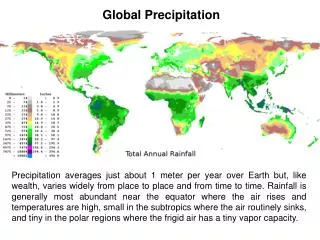
Introduction “Observational records and climate projections provide abundant evidence that freshwater resources are vulnerable and have the potential to be strongly impacted by climate change, with wide-ranging consequences for human societies and ecosystems.” IPCC (2008) Climate Change and Water
How should the water cycle respond to climate change? Hawkins and Sutton (2010) Clim. Dyn. See discussion in: Allen & Ingram (2002) Nature; Trenberth et al. (2003) BAMS
Climate model projections (IPCC 2007) Precipitation Intensity • Increased Precipitation • More Intense Rainfall • More droughts • Wet regions get wetter, dry regions get drier? • Regional projections?? Dry Days Precipitation Change (%)
Can we use observations to confirm robust responses? Precip. (%) Allan and Soden (2008) Science
Tropical ocean precipitation dP/dSST: GPCP: 10%/K(1988-2008) AMIP: 3-11 %/K(1979-2001) dP/dt trend GPCP: 1%/dec (1988-2008) AMIP: 0.4-0.7%/dec (1979-2001) (land+ocean) SSM/I GPCP Allan et al. (2010) Environ. Res. Lett.
Physical basis: energy balance Trenberth et al. (2009) BAMS
Models simulate robust response of clear-sky radiation to warming (~2 Wm-2K-1) and a resulting increase in precipitation to balance (~2 %K-1)e.g. Allen and Ingram (2002) Nature, Stephens & Ellis (2008) J. Clim Radiative cooling, clear(Wm-2) Latent Heat Release, LΔP (Wm-2) Lambert & Webb (2008) GRL Surface Temperature (K)
Models simulate robust response of clear-sky radiation to warming (~2 Wm-2K-1) and a resulting increase in precipitation to balance (~2 %K-1)e.g. Allen and Ingram (2002) Nature, Stephens & Ellis (2008) J. Clim Allan (2009) J. Clim Radiative cooling, clear (Wm-2K-1) NCAS-Climate Talk 15th January 2010
Trends in clear-sky radiation in coupled models Surface net clear-sky longwave Clear-sky shortwave absorption Allan (2009) J. Clim
Can we observe atmospheric radiative heating/cooling? John et al. (2009) GRL See also discussion in Trenberth and Fasullo (2010) Science
Surface net longwave and water vapour • Surface net longwave strongly dependent on column water vapour • Increased water vapour enhances ability of atmosphere to cool to the surface ERA40 NCEP SRB SSM/I Allan (2009) J . Climate
Current changes in tropical ocean column water vapour John et al. (2009) Water Vapour (mm) models Changing observing systems applied to reanalyses cause spurious variability.
Is the mean state important? • Models appear to overestimate water vapour • Pierce et al. (2006) GRL; John and Soden (2006) GRL • But not for microwave data? [Brogniez and Pierrehumbert (2007) GRL] • This does not appear to affect feedback strength • John and Soden (2006) • What about the hydrological cycle? • Symptomatic of inaccurate simulation? Pierce et al. (2006) GRL
Does low-level moisture rise at 7%/K? Specific humidity trend correlation (left) and time series (right) Willett et al. (2008) J Clim LandOcean Willett et al. (2007) Nature Robust relationships globally. Less coherent relationships regionally/over land/at higher altitudes? Evidence for reductions in RH over land (Simmons et al. 2009 JGR) which are physically plausible.
Evaporation Richter and Xie (2008) JGR CC Wind Ts-To RHo Muted Evaporation changes in models are explained by small changes in Boundary Layer:1) declining wind stress2) reduced surface temperature lapse rate (Ts-To)3) increased surface relative humidity (RHo) NCAS-Climate Talk 15th January 2010
Physical Basis: Moisture Transport scaling Change in Moisture Transport, dF (pg/day) If the flow field remains relatively constant, the moisture transport scales with low-level moisture. Model simulation Held and Soden (2006) J Climate
Projected (top) and estimated (bottom) changes in Precipitation minus Evaporation d(P-E) ~ Held and Soden (2006) J Climate
Physical Basis: Circulation response First argument: P ~ Mq. So if P constrained to rise more slowly than q, this implies reduced M Second argument: ω=Q/σ. Subsidence (ω) induced by radiative cooling (Q) but the magnitude of ω depends on (Гd-Г) or static stability (σ). If Г follows MALR increased σ. This offsets Q effect on ω. See Held & Soden (2006) and Zelinka & Hartmann (2010) JGR P~Mq
Physical Basis: Circulation response P~Mq Models/observations achieve muted precipitation response by reducing strength of Walker circulation. Vecchi and Soden (2006) Nature
Walker circulation index (top) and sea level pressure anomalies (bottom) over equatorial Pacific (1948-2007) • Evidence for recent increased strength of tropical Hadley/Walker circulation since 1979? • Sohn and Park (2010) JGR Hadley circulation index over 15oS-30oN band
Clausius-Clapeyron Low-level water vapour (~7%/K) Intensification of rainfall: Trenberth et al. (2003) BAMS; Pall et al. (2007) Clim Dyn Changes in intense rainfall also constrained by moist adiabat -O’Gorman and Schneider (2009) PNAS Does extra latent heat release within storms enhance rainfall intensity above Clausius Clapeyron? e.g. Lenderink and van Meijgaard (2010) Environ. Res. Lett.; Haerter et al. (2010) GRL Extreme Precipitation Physical basis: water vapour 1979-2002
Changes in Extreme Precipitation Determined by changes in low-level water vapour and updraft velocity Above: O’Gorman & Schneider (2008) J Clim Aqua planet experiment shows extreme precipitation rises with surface q, a lower rate than column water vapour Right:Gastineau and Soden (2009) GRL Reduced frequency of upward motion offsets extreme precipitation increases.
Analyse daily rainfall over tropical oceans SSM/I v6 satellite data, 1988-2008 (F08/11/13) Climate model data (AMIP experiments) Create rainfall frequency distributions Calculate changes in the frequency of events in each intensity bin Does frequency of most intense rainfall rise with atmospheric warming? Precipitation Extremes • Trends in tropical wet region precipitation appear robust. • What about extreme precipitation events? METHOD
Increases in the frequency of the heaviest rainfall with warming: daily data from models and microwave satellite data (SSM/I) Reduced frequency Increased frequency Allan et al. (2010) Environ. Res. Lett.
Increase in intense rainfall with tropical ocean warming (close to Clausius Clapeyron) SSM/I satellite observations at upper range of model range Turner and Slingo (2009) ASL: dependence on convection scheme? Observational evidence of changes in intensity/duration (Zolina et al. 2010 GRL) Links to physical mechanisms/relationships required (Haerter et al. 2010 GRL)
Contrasting precipitation response expected Heavy rain follows moisture (~7%/K) Mean Precipitation linked to radiation balance (~3%/K) Precipitation Light Precipitation (-?%/K) Temperature e.g.Held & Soden (2006) J. Clim; Trenberth et al. (2003) BAMS; Allen & Ingram (2002) Nature
The Rich Get Richer? Is there a contrasting precipitation response in wet and dry regions? Models ΔP [IPCC 2007 WGI] Precip trends, 0-30oN Rainy season: wetter Dry season: drier Chou et al. (2007) GRL
Detection of zonal trends Zhang et al. 2007 Nature
Contrasting wet/dry precipitation responses GPCP Ascent Region Precipitation (mm/day) John et al. (2009) GRL • Large uncertainty in magnitude of change: satellite datasets and models & time period TRMM • Robust response: wet regions become wetter at the expense of dry regions. Is this an artefact of the reanalyses?
Contrasting precipitation response in wet and dry regions of the tropical circulation ascent Observations Models Precipitation change (%) descent Sensitivity to reanalysis dataset used to define wet/dry regions Allan et al. (2010) Environ. Res. Lett.
Sample grid boxes: 30% wettest 70% driest Do wet/dry trends remain? Avoid reanalyses in defining wet/dry regions Allan et al. (2010) Environ. Res. Lett.
Current trends in wet/dry regions of tropical oceans Wet/dry trends remain 1979-1987 GPCP record may be suspect for dry region SSM/I dry region record: inhomogeneity 2000/01? GPCP trends 1988-2008 Wet: 1.8%/decade Dry: -2.6%/decade Upper range of model trend magnitudes DRY WET Models Allan et al. (2010) Environ. Res. Lett.
Binning by regime (a) P (mm/day); % area (b) Model–GPCP P (%) (c) 2080-99 – 1980-99 P (%/K); (d) ω Vertical motion (ω) percentiles ascent descent Precipitation binned in percentiles of vertical motion (0-5% bin is strongest ascent) and temperature (95-100% bin is warmest) for the HadGEM1 model (top) and an ensemble of 10 CMIP3 models (bottom). (a) Mean precipitation and % area enclosed in each contour, (b) model – GPCP precipitation and model change in (c) precipitation (scaled by temperature change) and (d) vertical motion for 2080-99 minus 1980-99. e.g. see also Emori and Brown (2005) GRL
Transient responses Andrews et al. (2009) J Climate
Transient responses • CO2 forcing experiments • Initial precip response supressed by CO2 forcing • Stronger response after CO2 rampdown CMIP3 coupled model ensemble mean: Andrews et al. (2010) Environ. Res. Lett. Degree of hysteresis determined by forcing related fast responses and linked to ocean heat uptake HadCM3: Wu et al. (2010) GRL
Forcing related fast responses Total Slow • Surface/Atmospheric forcing determines “fast” precipitation response • Robust slow response to T • Mechanisms described in Dong et al. (2009) J. Clim • CO2 physiological effect potentially substantial (Andrews et al. 2010 Clim. Dyn.; Dong et al. 2009 J. Clim) • Hydrological Forcing: HF=kdT-dAA-dSH (Ming et al. 2010 GRL; also Andrews et al. 2010 GRL) Precipitation response (%/K) Andrews et al. (2010) GRL Can NWP help? e.g. Sean Milton/PAGODA
Outstanding issues Satellite estimates of precipitation, evaporation and surface flux variation are not reliable. Are regional changes in the water cycle, down to catchment scale, predictable? How well do models represent land surface and physiological feedbacks. How is the water cycle responding to aerosols? Linking water cycle and cloud feedback issues
Robust Responses Low level moisture; clear-sky radiation Mean and Intense rainfall Observed precipitation response at upper end of model range? Contrasting wet/dry region responses Less Robust/Discrepancies Moisture at upper levels/over land and mean state Inaccurate precipitation frequency/intensity distributions Magnitude of change in precipitation from satellite datasets/models Further work Decadal changes in global energy budget, aerosol forcing effects and cloud feedbacks: links to water cycle? Precipitation and radiation balance datasets: forward modelling Separating forcing-related fast responses from slow SST response Boundary layer changes and surface fluxes Conclusions