Download
1 / 94
960 likes | 1.23k Views
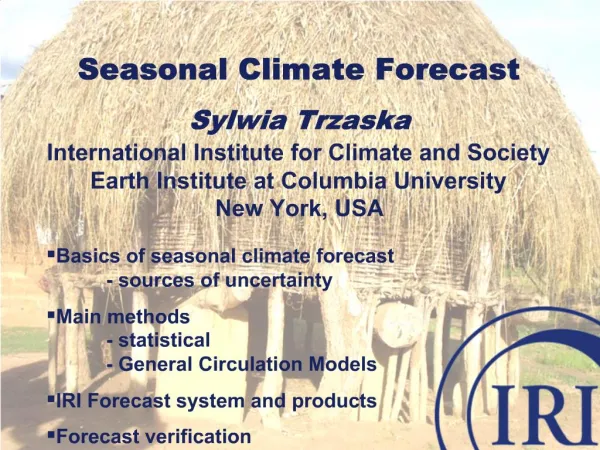
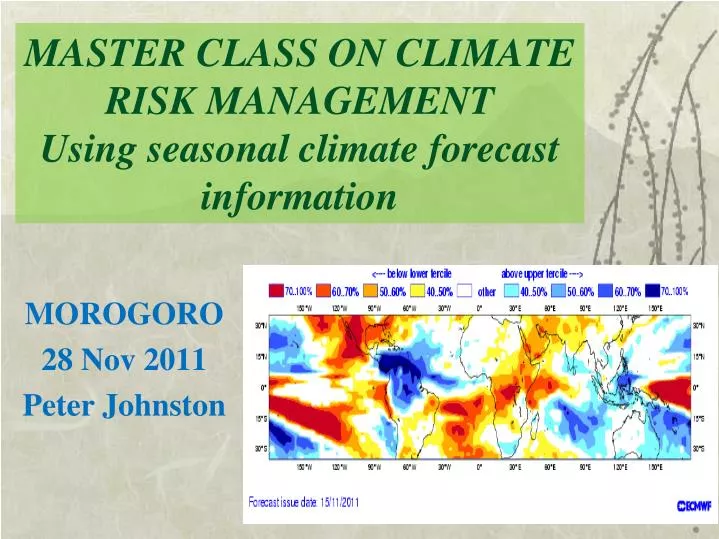
MASTER CLASS ON CLIMATE RISK MANAGEMENT Using seasonal climate forecast information. MOROGORO 28 Nov 2011 Peter Johnston. SEASONAL FORECASTING 3 month average. The theory behind them How are they made? Sources of SFs The message they convey Is it reliable? Their uptake and use

E N D
MASTER CLASS ON CLIMATE RISK MANAGEMENTUsing seasonal climate forecast information MOROGORO 28 Nov 2011 Peter Johnston
SEASONAL FORECASTING3 month average • The theory behind them • How are they made? • Sources of SFs • The message they convey • Is it reliable? • Their uptake and use • Opportunities • Barriers and limitations
Basic principles • Weather forecasts vs. climate forecasts • limit to predictability of weather (10-14 days) • but we can say something about climate beyond that • Methods: empirical vs. dynamic • Forcing • SSTs account for much of the variability in climate • Land surface?
Uncertainty • Sources of uncertainty • Ensemble forecasts • different initial conditions • different models • Systematic bias • Different variables • Deterministic vs. probabilistic
Producing the forecast • GCM • HadAM3 • SSTs • forecast (SAWS) • persisted (NCEP) • Run the model! • 4-month spin-up • 6-month forecast • 10 ensemble members
Historically El-Nino is GENERALLY associated with dry (or wet) and warm conditions
The basis of most predictions are sea surface temperature (SST) anomalies. These can be monitored directly using: • Satellites • Buoys • Ships
Making the rainfall forecast Dynamical forecast using a GCM Statistical forecast using a linear or non-linear model e.g.CCA,EOF, SVD,ANN Rainfall forecasts SST forecast from either: • persisted SSTs (good < 3 months into future) 2. Forecast SSTs (better > 3 months into future) • dynamical ocean-atmosphere model • statistical forecast
However, forecasts are not ‘deterministic’ i.e. they do not say such and such WILL occur. They are presented in terms of probability – represented by a probability density function (PDF – not the electronic document !) To represent how this PDF changes with the forecast it must be ‘sampled’ many times :– for a dynamic model make many different forecasts, each starting from different initial conditions for a statistical model use a monte-carlo approach where the SSTs are perturbed slightly again from different initial conditions
Shift in the probability density function (PDF) La Nina years (red) more frequently associated with high precipitation (to the right of the graph)
Mean annual rainfall Mean annual surface temperature
Time Series Jan-May rainfall Mean rainfall (Jan 1st to May 31st ) = 700mm CV% = 23%
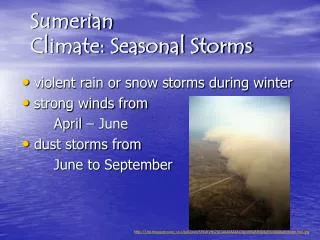
Dry Spells Dry spells of 7 day duration occur every year in cropping period Jan15-May31st Extend to 14 day dry spells in 8 of 24 seasons (33%) - 1990 ignored
HUMAN ELEMENTS OF CLIMATE FORECASTING • Impacts • Applications • Usefulness • Accuracy • Research Questions
Impacts • Resource sectors • Agriculture • Commercial • Emerging • Informal • Forestry • Water • Fishing • Commerce • Utilities
Applications • Seasonal forecasts • Rainfall and temperature predictions • Crop selection/ crop yield predictions • Modelling and scenarios • Hazards, disasters and extreme event forecasts (esp. drought and flood) • Commercial planning • Water resource planning • Health – disease boundaries
Usefulness • Information content • Spatial and temporal distribution of rainfall • Other optimal parameters • Information interpretation • Planting times • Growing seasons • Optimal crop selection • Information presentation and distribution • Format – probability • Media • extension offices, word of mouth • Newspaper, radio, TV, internet
Accuracy • Skill = Likelihood ? • Probability/uncertainty = Reliability • Verification • Risk • Consequences • Liability • Feedback sensitive
The Forecaster’s Quest What is going to happen, and how confident are we that it will happen? How do we ensure that a forecast is useful and has value?
Research Questions • What does the customer actually want? • How will the information be presented? • How will the users receive the information? • How will forecast accuracy be conveyed? • How can vulnerability to climatic variation be reduced? • How can traditional methods of forecasting and planning complement scientific ones?
Seasonal Forecasts and agricultural decision-makingAn inside perspective
Research Questions… • What do maize farmers find useful to assist decision making? • Why are farmers not making better use of the current forecasts? • Can farmers make ‘better’ decisions?
..in summary….. • Highresolution prediction • Advance notice of seasonal rainfall: • Mid season dry spell • Onset • Distribution • Cessation • Follow up and updates • Post season/monthly analyses
What the farmer thinks of forecasts….. Farmers using forecasts: • 83% find them ‘useful’ Random sample: • 76%receive some sort of forecast • 18% - Met Office, 64% another source (PP!) • 33%trust the forecast • Relevant: 23% very, 37% fairly, 21% not at all
What would he do differently? • 68%crop selection • 47%cultivar selection • 63%planting planning
But do they understand..? • 67 %understood ‘normal’ rainfall • 79%using farmers interpreted probability • 33 %of random sample • 64% - were confident • 33% of those were wrong
11% 89%
What’s to understand..? “The forecast for the remainder of the summer rainfall season suggests the persistence of an erratic rainfall pattern. Over the central interior regions, however, enhanced probabilities of near-normal rainfall are forecast. Over the north-eastern regions, there is a significant chance of a continuation of sporadic rainfall events that will do little to alleviate the current drought conditions over that area.”
Making Decisions • Bounded rationality: • Each decision maker has a finite amount of information upon which to base any decision • Anchoring – based upon some previous experience • Validity of decision is a function of truth (consistency) and accuracy (represent reality) • Some forecast users, finding themselves overwhelmed by the array of choice and decision options, settle for the forecast easiest to access, physically and mentally, rather than the most suitable…
Making wrong decisions.. • False expectations about various forecasting models and their outputs. • Insufficient understanding about the interpretation and application of a forecast to a specific case. • An inappropriate application or response based on forecast information. (Farago et al 1997)
Living with a wrong decision… • ‘Cognitive dissonance’: justification of one’s decision when ‘action’ disagrees with ‘attitude’ • 3 mental mechanisms to ensure that actions and attitudes are in harmony (reducing dissonance). • Selective exposure – keeping within the walls • Post-decision reassurance – cost, time taken, irreversibility – finding common ground from others who agreed with decision. • Minimal justification = greater attitudinal change – smaller rewards get more positive reaction (cup-holders vs fuel consumption)
Need to know …. • What is involved in his decision making? • What has the greatest influence? • How to increase the finite sphere of information • How to increase the ability and willingness to utilise SF’s
Forecaster obligations.. Fidelity/Bravery/Intelligence • Forecasts need to be honest and have intimate knowledge of user needs • Limitations of the forecast are the starting point • Probability and skill must be explained
Researcher’s obligations • Users have differing attitudes • disbelief • mistrust • cynical • misinterpretation • cognitive dissonance - reinforcing decisions • research required to compare the impact on commercial and emerging/s-scale farmers • farmers will use forecasts when they are good and ready….
Suggestions for forecasts in the future…. • Monthly forecasts i.p.o. 3-monthly • Regional forecasts – background normals? • Total season overview • Probability and skill must be explained • More interpretation is desired • Forecast must describe limitations • Forecasts need to have intimate knowledge of user needs – means identifying specific user sectors
Applications of seasonal forecasts: value, limitations and responsibilitiesMaximising usefulness for end-users
Longer term forecasts11-30 day http://dev2.weathersa.co.za/web/Content.asp?contentID=91