Download
1 / 18
180 likes | 258 Views
WP5 UPDATE. Dynamics of supply-chain and market volatility of networks. Fernanda Strozzi Cattaneo University-LIUC Italy. Contents. Main results of D5.3 (Strozzi) Application of nonlinear time series (Nord Pool data) Correlation between Electricity prices and

E N D
WP5 UPDATE Dynamics of supply-chain and market volatility of networks Fernanda Strozzi Cattaneo University-LIUC Italy
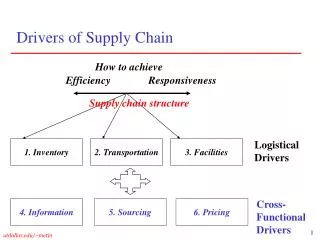
Contents • Main results of D5.3 (Strozzi) • Application of nonlinear time series (Nord Pool data) • Correlation between Electricity prices and Disturbances (Nordel data) • SVARs and DFMs for modeling electricity prices (Manera/Serati) • General Model of Supply Chain (Rossi/Noè)
D5.3 (M24) The study of electricity market properties and its correlation with the faults in the electricity newtork using Cross Recurrence Quantification Analysis. • 1. APPLICATION OF NON-LINEAR TIME SERIES ANALYSIS • TECHNIQUES TO THE NORDIC SPOT ELECTRICITY MARKET • DATA. • a. LIUC paper 200, October 2007 • b. Time series analysis and long range correlations of Nordic spot electricity market data, Erzgraber, Strozzi, Zaldivar, Touchette, Gutierrez, Arrowsmith, Phy A • c. Measuring volatility in the Nordic spot electricity market using Recurrence Quantification Analysis. Strozzi, Gutiérrez, Noè, Rossi, Serati and Zaldívar . European Journal of Physics-ST, 2008 • 2. CORRELATION ANALYSIS BETWEEN FAULTS IN THE • ELECTTRICITY GRID AND SPOT PRICES IN THE NORDIC • REGION. • LIUC paper xxx, February 2009. • Work in preparation for Energy Policy.
D5.3 (M24) 1.APPLICATION OF NON-LINEAR TIME SERIES ANALYSIS TECHNIQUES TO THE NORDIC SPOT ELECTRICITY MARKET DATA Main Results • R/S analysis confirms long range correlation and anti-persistence. • Stable distribution fitting of electricity prices. • Recurrence Quantification Analysis and in particular determinism is able to distinguish between real and surrogate (Gaussian with the same FFT) data. • Determinism and laminarity as volatility measures. Dynamic-statistic properties.
D5.3 (M24) 2. CORRELATION ANALYSIS BETWEEN FAULTS IN THE ELECTTRICITY GRID AND ELECTRICITY PRICES IN THE NORDIC REGION Main Results • Disturbance volatility is linear correlated with price first differences using window of six or twelve months. w=12, sh=1, R=0.7567, p=0.0000; w=12, sh=12, R=0.8138, p=0.0488 w=6, sh=6, R= -0.7778, p=0.0017 • Applying PCA on the 12 time series obtained by S, D, T we found that to explain at least 90% of variance we need more than 3 principal components. Linear correlation coefficient
D5.3 (M24) 2. CORRELATION ANALYSIS BETWEEN FAULTS IN THE ELECTTRICITY GRID AND SPOT PRICES IN THE NORDIC REGION Cross Correlation Function
D5.3 (M24) 2. CORRELATION ANALYSIS BETWEEN FAULTS IN THE ELECTTRICITY GRID AND SPOT PRICES IN THE NORDIC REGION • Cross Correlation function calculated using Disturbances and Spot prices (w=2, sh=1) has a regular oscillating behaviour even if it never reaches values higher than R=0.4.
D5.3 (M24) 2. CORRELATION ANALYSIS BETWEEN FAULTS IN THE ELECTTRICITY GRID AND SPOT PRICES IN THE NORDIC REGION Cross Recurrence Plot • Using Cross Recurrence Plot we • identify time series that are linear • correlated only on for some time.
D5.3 (M24) 2. CORRELATION ANALYSIS BETWEEN FAULTS IN THE ELECTTRICITY GRID AND SPOT PRICES IN THE NORDIC REGION
Key insight and results associated with the deliverables D5.1-3 • D5.1 (M12). Supply-chain logical model by means of the Petri nets and its interconnection with the electric network . Modeling of the elementary components of a supply chain and their interconnection with the electric network. • D5.2(M12) Literature analysis of electricity market dynamics models. Usually: Statistical and not econometric models, univariate approach. • D5.3 (M24) Study of the relationship between market volatility and the dynamics of power system using Cross Recurrence Quantification Analysis. A linear correlation exists between Prices and disturbacies. • D5.4 (M30) coupled market, power systems and supply chain dynamics. • D5.5 (M36) Early warning detection algorithm and suggestions on how implement it in real systems.
LIUC collaboration to date and planned for the future • JRC and Queen Mary 1_Time series analysis and long range correlations of Nordic spot electricity market data, H.Erzgraber, F. Strozzi, J.M. Zaldivar, H.Touchette, E. Gutierrez, D.K.Arrowsmith, Physica A, 2008 2_ Measuring volatility in the Nordic spot electricity market using Recurrence Quantification Analysis. F. Strozzi, E.Gutiérrez, C. Noè, T. Rossi, M.Serati and J.M. Zaldívar . European Journal of Physics-ST, 2008. • NESA Quantifying and ranking risks. C. Colicchia, H. Sivonen, C. Noè, F. Strozzi. IPMA world congress Rome 9-11 Nov 2008 • COLB (to be discussed) • MASA(to be discussed about supply chain vulnerability and the aplication of Markov chain model)
Outreach activities: LIUC efforts • International Conference on applied simulation and modeling, Corfù (June 2008) Analysis of complex systems by means of mathematical and simulation methods (Noè/Rossi) . EDF (Électricité de France) • The 23rd European Conference on Operational Research EURO XXIII, Bonn, July 5- 8 2009 Streem: Methodology of Societal Complexity • MANMADE project (accepted) • Ranking vulnerability in a supply chain (in preparation)
Update of deliverable D5.5 (M36)Early warning detection algorithm and suggestions on how to implement it in real systems ….. • Analysis of the divergence operator for the stability evaluation of a small electric network weakly connected to the main electric network or isolated and in which one node is constituted by a source of renewable energy. • We will study the transient stability of the system due for example to an external perturbation or a fault or a generator malfunction or to the non constant supply of a renewable source.
……Update of deliverable D5.5 (M36) • The perturbations have direct implications on the balance of the active power i.e. on the dynamic equilibrium of the electric network. • After the perturbation a transient appears in which the net frequency increases or decreases. • The feedback on the system can be a signal of correction for this balance. Note: this work will be done in collaboration with the electric engineering department of Politecnico of Milan. They already started to develop the electric model.
Brief plan /update ofRemaining deliverables • D5.4 (M30) coupling between electricity market and supply chain model (Rossi, Serati, Noè, Manera, JRC) • Vulnerability of a supply chain using influence model: work in progress (Colicchia, Strozzi, Noè, MASA, QUML). (T5.6) • D5.5 (M36) Early warning detection algorithm and suggestions on how to implement it in real systems (Strozzi, COLB?)
WP5: Tasks overview EWDS of Blackouts T5.4 Coupling models Task5.5 Electricity price Model T5.1 Interaction Risk T5.6 Electric power Model T5.1 Correlation Analysis(T5.2-T5.3) Supply chain Model T5.1, T5.5 Energy spot prices Volatility Blackouts Volatility
Conferences DISSEMINATION 1_ Analysis of complex systems by means of mathematical and simulation methods (Noè/Rossi) . International Conference on applied simulation and modeling, Corfù (June 2008) 2_ Quantifying and ranking risks. C. Colicchia, H. Sivonen, C. Noè, F. Strozzi. IPMA world congress Rome 9-11 Nov 2008 3_Application of RQA to Financial Time Series, F. Strozzi, J.M. Zaldivar, J. Zbilut, Second International workshop on Recurrence Plot, Siena, 10-12 September 2007. Reports -Application of non-linear time series analysis techniques to the Nordic spot electricity market F. Strozzi, E.Gutiérrez, C. Noè, T. Rossi, M.Serati and J.M.Zaldívar. LIUC Paper 200,October 2007 -Deliverables D5.1, D5.2 Papers 1_Time series analysis and long range correlations of Nordic spot electricity market data, H.Erzgraber, F. Strozzi, J.M. Zaldivar, H.Touchette, E. Gutierrez, D.K.Arrowsmith, Physica A 2_ Measuring volatility in the Nordic spot electricity market using Recurrence Quantification Analysis. F. Strozzi, E.Gutiérrez, C. Noè, T. Rossi, M.Serati and J.M. Zaldívar . European Journal of Physics-ST, 2008 3_ A supply chain as a serie of filter or amplificators of the bullwhip effect . Caloiero, G., Strozzi, F., Zaldívar, J.M., 2007. International Journal of Production Economics 2008 4_Control and on-line optimization of one level supply chain, F. Strozzi, C.Noè, J.M. Zaldivar, submitted to IJPE, 2008