Download
1 / 2
20 likes | 121 Views
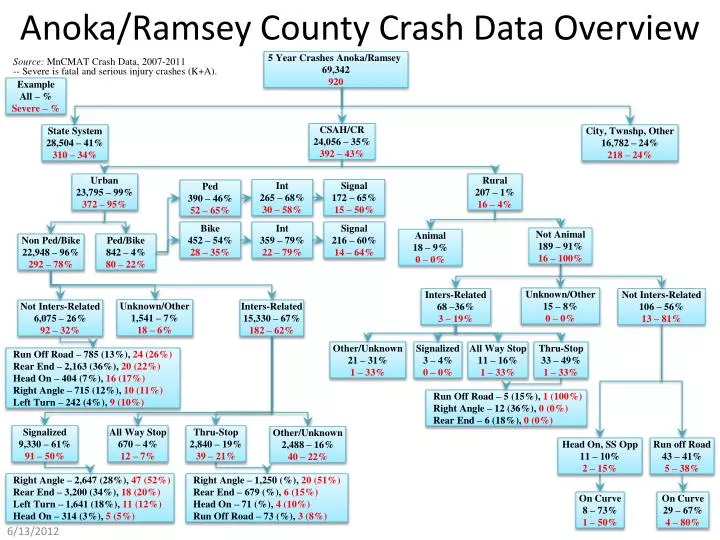
Anoka/Ramsey County Crash Data Overview. 5 Year Crashes Anoka/Ramsey 69,342 920. Example All – % Severe – %. CSAH/CR 24,056 – 35% 392 – 43%. State System 28,504 – 41% 310 – 34%. City, Twnshp , Other 16,782 – 24% 218 – 24%. Source: MnCMAT Crash Data, 2007-2011

E N D
Anoka/Ramsey County Crash Data Overview 5 Year Crashes Anoka/Ramsey 69,342 920 Example All – % Severe – % CSAH/CR 24,056 – 35% 392 – 43% State System 28,504 – 41% 310 – 34% City, Twnshp, Other 16,782 – 24% 218 – 24% Source: MnCMAT Crash Data, 2007-2011 -- Severe is fatal and serious injury crashes (K+A). Urban 23,795 – 99% 372 – 95% Rural 207 – 1% 16 – 4% Int 265 – 68% 30 – 58% Signal 172 – 65% 15 – 50% Ped 390 – 46% 52 – 65% Bike 452 – 54% 28 – 35% Int 359 – 79% 22 – 79% Signal 216 – 60% 14 – 64% Not Animal 189 – 91% 16 – 100% Animal 18 – 9% 0 – 0% Non Ped/Bike 22,948 – 96% 292 – 78% Ped/Bike 842 – 4% 80 – 22% Unknown/Other 15 – 8% 0 – 0% Inters-Related 68 –36% 3 – 19% Not Inters-Related 106 – 56% 13 – 81% Unknown/Other 1,541 – 7% 18 – 6% Not Inters-Related 6,075 – 26% 92 – 32% Inters-Related 15,330 – 67% 182 – 62% Other/Unknown 21 – 31% 1 – 33% Signalized 3 – 4% 0 – 0% All Way Stop 11 – 16% 1 – 33% Thru-Stop 33 – 49% 1 – 33% Run Off Road – 785 (13%), 24 (26%) Rear End – 2,163 (36%), 20 (22%) Head On – 404 (7%), 16 (17%) Right Angle – 715 (12%), 10 (11%) Left Turn– 242 (4%), 9 (10%) • Run Off Road – 5 (15%), 1 (100%) Right Angle – 12 (36%), 0 (0%) Rear End – 6 (18%), 0 (0%) Signalized 9,330 – 61% 91 – 50% All Way Stop 670 – 4% 12 – 7% Thru-Stop 2,840 – 19% 39 – 21% Other/Unknown 2,488 – 16% 40 – 22% Head On, SS Opp 11 – 10% 2 – 15% Run off Road 43 – 41% 5 – 38% Right Angle – 2,647 (28%), 47 (52%) Rear End – 3,200 (34%), 18 (20%) Left Turn – 1,641 (18%), 11 (12%) Head On – 314 (3%), 5 (5%) Right Angle – 1,250 (%), 20 (51%) Rear End – 679 (%), 6 (15%) Head On – 71 (%), 4 (10%) Run Off Road – 73 (%), 3 (8%) On Curve 8 – 73% 1 – 50% On Curve 29 – 67% 4 – 80%
Code Guide • Animal, ACCTYPE=08,09 • Rear End, DIAG=01 • Left Turn, DIAG=03 • Right Angle, DIAG=05 • Run off Road, DIAG=04, 07 (Road departure) • Head On, SS Opp, DIAG=08, 09 (Lane departure) • Curve-Related, ROAD CHAR=05-08 • State, SYS=01, 02, 03 • CSAH/CR, SYS=04, 07 • City, Twnshp, Other, SYS=NOT 01-03, 04 or 07 • Urban, City coded • Rural, City not coded (0000) • Intersection-Related, JUNC=2-7, 20-22 • Not Intersection-Related, JUNC=1, 8-11 • Other/Unknown, JUNC=90, 98, 99, 00 • Signalized, TCD=01 • All-Way Stop, TCD=02, 03 • Thru-Stop/Yield, TCD=04, 05 • Other/Unknown, TCD=>06 and 00