Download
1 / 21
210 likes | 329 Views
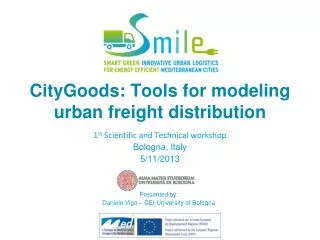
Exploratory Use of Raster Images for Freight Modeling. Pedro Camargo PhD Student University of California, Irvine TRB – SHRP2 SYMPOSIUM Innovations in Freight Demand Modeling and Data Improvement October 2013. Outline. C alifornia S tatewide F reight F orecasting M odel CropScape

E N D
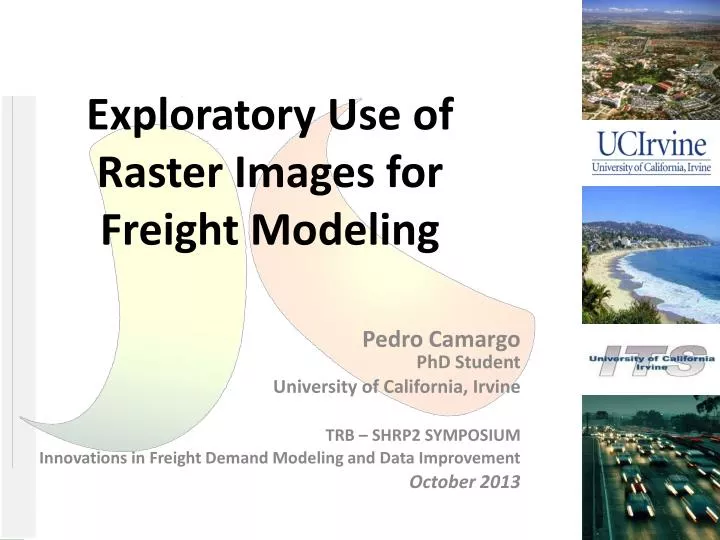
Exploratory Use of Raster Images for Freight Modeling Pedro Camargo PhD Student University of California, Irvine TRB – SHRP2 SYMPOSIUM Innovations in Freight Demand Modeling and Data Improvement October 2013
Outline • California Statewide Freight Forecasting Model • CropScape • FAF Disaggregation • Agriculture Seasonality Analysis • Other public GIS datasets
CSFFM • Commodity based • Developed using FAF3 • Aggregated to 15 commodity groups • All agricultural products are in the same group • 97 Freight Analysis zones in California • US network (only major truck routes outside CA) • Will be integrated with California Statewide Travel demand Model (CSTDM) passenger travel model • Spatial disaggregation needed • Temporal disaggregation needed
CSFFM Carried over to mode split and assignment % of total flows moved on each day Output from generation/ distribution
CropScape • Project of the United States Department of Agriculture* • Raster images for all 48 contiguous states from 2008 onwards (since 1997 for some states) * - http://nassgeodata.gmu.edu/CropScape/
General characteristics • Developed using remote sensing technology • Each pixel is 0.77 acre • Virtually any spatial aggregation can be used for modeling purposes • Accuracy: • “Generally, the large area row crops have produced accuracies ranging from mid 80% to mid 90%” • 105 different crops identified • 5 types of developed areas and 23 other area types
Obtaining an image • All areas viewed by remote sensing every 5 days • Each pixel in each picture is classified according to its reflectance (256 levels of gray in the picture) • Ground truth is checked and used to correlate classes to actual soil use (different crops, barren land, water, populated areas, etc.) • The annual picture is created in consideration of all the classifications for each pixel in each image
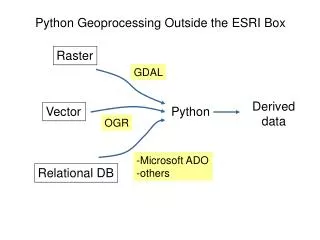
CropScape Processing • CropScape presents processed state AND county data for 2010-12 • Images for 2012 sum up to about 13.8Gb • Processing with free software is painless • GDAL tools inside GRASS* • Scripting with Python is trivial • Processing of all images for 2012 on a current high powered laptop takes less than 3h * - http://grass.osgeo.org/
FAF Disaggregation • FAF* is one of the primary sources for data used to develop freight models • Frequent topic in the literature • Applications in Florida, New Jersey, Washington DC, etc. • Lack of variables for less than county geographies • Agriculture is one of the industries with the least amount of available data * - http://www.ops.fhwa.dot.gov/freight/freight_analysis/faf/
Disaggregating Agricultural Products • FAF3 baseline is 2007, but CropScapeis only available starting in 2008 • Disaggregation of 2011 provisional FAF with 2011 CropScape • Disaggregation of FAF 3 with 2008 CropScape data • There is a LOT more that can be tried • 30 different grain crops • 75 non-grain crops
More to explore • Several commodity groups could be disaggregated with CropScape: • Construction related commodities could be disaggregated by using developed area information • Logs for paper/construction can be disaggregated using areas classified as forests
Agricultural forecasts • CropScape allows for the estimation of currently unused land: • Provides an upper limit on planted areas • Allied to estimates of future yields, it is a robust forecasting tool • Expansion of planted area can be tracked • Precipitation raster images are also available
Seasonality Analysis • Why compute seasonality factors? • FAF presents yearly flows and agriculture is highly seasonal • Is it possible to use other data sources? • Yes, but only CropScape covers ALL crops and areas consistently
VegScape • Information on vegetation vigor/strength • Just launched in April 2013 • Much coarser resolution than CropScape (~15 acre) • Daily/Weekly information
Other available GIS databases • USDA – Natural Resources Conservation Service* • Topography / Elevation (raster) • Conservation Easements (vector) • National Land Cover Data Set (NLCD) (raster) • Hydrography (vector) • Annual average temperatures (vector) • Precipitation (vector) * - http://datagateway.nrcs.usda.gov/GDGOrder.aspx?order=QuickState