Download
1 / 17
170 likes | 252 Views
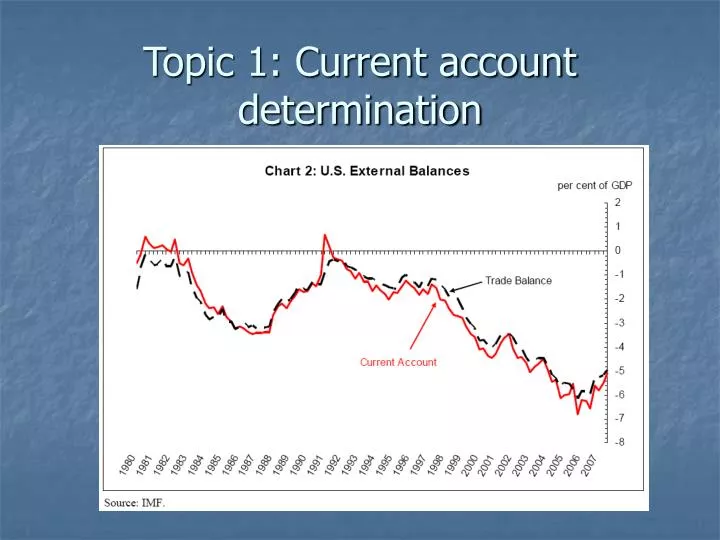
Topic 1: Current account determination. Balance of payments accounting. FRBNY article, June 2004 BEA international statistics (www.bea.gov) FRB Bulletin, May 2003 Any intermediate macroeconomics textbook. Net external liabilities.

E N D
Balance of payments accounting • FRBNY article, June 2004 • BEA international statistics (www.bea.gov) • FRB Bulletin, May 2003 • Any intermediate macroeconomics textbook
Net external liabilities • Current account deficits cumulate to net external liabilities • See www.bea.gov/bea/newsrel/intinvnewsrelease.htm • Focus on gross and net positions
Net International Investment Position of the United States at Year end, 1989 – 2007 • See: http://www.bea.gov/international/xls/intinv07_t2.xls
U.S. NIIP 2007 • NIIP at year end: about -$2.5 trillion (with FDI at current cost) • US-owned assets abroad $17.6 trillion • Foreign securities $6.6 trillion • US FDI abroad $3.93 trillion • Bank claims $3.8 trillion • Foreign-owned assets in US: $20.1 trillion
Revaluation effects • Price changes: Greater share of FDI and portfolio equities in US assets than in US liabilities • Exchange rate changes: US liabilities largely denominated/priced in dollars, while US assets mostly denominated in foreign currency • Net liabilities decline when dollar depreciates
Exchange rate changes • About two-thirds of US assets denominated in foreign currency • 10 percent depreciation in dollar $1200 billion dollar value of gross US assets • Equivalent to roughly 7 percent of GDP • Lowers net payments on NIIP by 0.28 percent of GDP (.04 7%)
Factors driving global imbalances • Two main views • “Trade-flows” versus “Capital-flows” view • Does the trade flows drive capital flows or vice-versa?
Trade-flows view • Elasticities approach to trade • See: Hooper, Johnson, and Marquez (1998), Chinn (2005) • Idea: Relate trade flows to relative prices and importer income • Income: GDP or domestic demand • Relative prices: real trade-weighted (effective) exchange rate
Trade equations • All variables in logs Xt = Y*t + 1Rt-1 + 2Rt-2 Mt = Yt + 1Rt-1 + 2Rt-2 • where: • X = real exports • M = real (non-oil) imports • Y = Domestic income; Y*= Foreign income • R = Real effective exchange rate
Empirical results for the US • Good statistical fit • > > 0 • Houthakker-Magee asymmetry • Implication: with constant prices and equal U.S. and foreign income growth, U.S. trade deficit widens • ’s and ’s small • In part reflecting incomplete pass-through
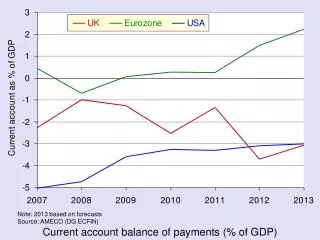
U.S. trade deficit • U.S. economy has been outperformed major trading partners 1997-2006 • Real dollar appreciated sharply from 1996 to 2001; depreciated since 2002 • Gap between imports and exports now so large that a marked acceleration in exports is needed to close trade deficit
U.S. trade deficit • Partial equilibrium: trade deficit drives financial flows • General equilibrium: if ex-ante trade and financial flows differ, then the real exchange rate adjusts to equate the ex-post flows