Download
1 / 36
360 likes | 432 Views
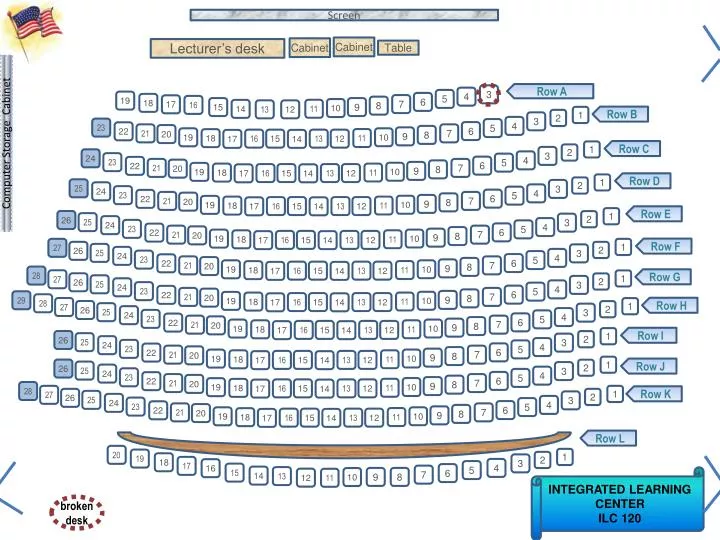
Screen. Cabinet. Cabinet. Lecturer’s desk. Table. Computer Storage Cabinet. Row A. 3. 4. 5. 19. 6. 18. 7. 17. 16. 8. 15. 9. 10. 11. 14. 13. 12. Row B. 1. 2. 3. 4. 23. 5. 6. 22. 21. 7. 20. 8. 9. 10. 19. 11. 18. 16. 15. 13. 12. 17. 14. Row C. 1. 2.

E N D
Screen Cabinet Cabinet Lecturer’s desk Table Computer Storage Cabinet Row A 3 4 5 19 6 18 7 17 16 8 15 9 10 11 14 13 12 Row B 1 2 3 4 23 5 6 22 21 7 20 8 9 10 19 11 18 16 15 13 12 17 14 Row C 1 2 3 24 4 23 5 6 22 21 7 20 8 9 10 19 11 18 16 15 13 12 17 14 Row D 1 2 25 3 24 4 23 5 6 22 21 7 20 8 9 10 19 11 18 16 15 13 12 17 14 Row E 1 26 2 25 3 24 4 23 5 6 22 21 7 20 8 9 10 19 11 18 16 15 13 12 17 14 Row F 27 1 26 2 25 3 24 4 23 5 6 22 21 7 20 8 9 10 19 11 18 16 15 13 12 17 14 28 Row G 27 1 26 2 25 3 24 4 23 5 6 22 21 7 20 8 9 29 10 19 11 18 16 15 13 12 17 14 28 Row H 27 1 26 2 25 3 24 4 23 5 6 22 21 7 20 8 9 10 19 11 18 16 15 13 12 17 14 Row I 1 26 2 25 3 24 4 23 5 6 22 21 7 20 8 9 10 19 11 18 16 15 13 12 17 14 1 Row J 26 2 25 3 24 4 23 5 6 22 21 7 20 8 9 10 19 11 18 16 15 13 12 17 14 28 27 1 Row K 26 2 25 3 24 4 23 5 6 22 21 7 20 8 9 10 19 11 18 16 15 13 12 17 14 Row L 20 1 19 2 18 3 17 4 16 5 15 6 7 14 13 INTEGRATED LEARNING CENTER ILC 120 9 8 10 12 11 broken desk
Introduction to Statistics for the Social SciencesSBS200, COMM200, GEOG200, PA200, POL200, or SOC200Lecture Section 001, Spring, 2013Room 120 Integrated Learning Center (ILC)10:00 - 10:50 Mondays, Wednesdays & Fridays. Welcome http://www.youtube.com/watch?v=oSQJP40PcGI
Lab sessions Labs continue This week
Please click in My last name starts with a letter somewhere between A. A – D B. E – L C. M – R D. S – Z Please hand in your homework
Use this as your study guide By the end of lecture today3/4/13 Logic of hypothesis testing Steps for hypothesis testing Levels of significance (Levels of alpha) what does alpha of .05 mean? what does p < 0.05 mean? what does alpha of .01 mean? what does p < 0.01 mean? Type I vs Type II Error http://onlinestatbook.com/stat_sim/sampling_dist/index.html http://www.youtube.com/watch?v=ne6tB2KiZuk http://today.msnbc.msn.com/id/33411196/ns/today-today_health/ http://www.youtube.com/watch?v=0r7NXEWpheg
Schedule of readings Before next exam (April 5th) Please read chapters 7 – 11 in Ha & Ha Please read Chapters 2, 3, and 4 in Plous Chapter 2: Cognitive Dissonance Chapter 3: Memory and Hindsight Bias Chapter 4: Context Dependence
Homework due – Wednesday (March 6th) On class website: Please print and complete homework worksheet #15 Type I versus Type II Errors
Confidence Interval of 95%Has and alpha of 5%α = .05 Confidence Interval of 99% Has and alpha of 1% α = .01 99% Area outside confidence interval is alpha 95% Area in the tails is called alpha 90% Confidence Interval of 90% Has and alpha of 10% α = . 10 Area associated with most extreme scores is called alpha
Measurements that occur within the middle part of the curve are ordinary (typical) and probably belong there Area outside confidence interval is alpha Area outside confidence interval is alpha Moving from descriptive stats into inferential stats…. 99% 95% Measurements that occur outside this middle ranges are suspicious, may be an error or belong elsewhere 90%
How do we know if something is going on?How rare/weird is rare/weird enough? Every day examples about when is weird, weird enough to think something is going on? • Handing in blue versus white test forms • Psychic friend – guesses 7 out of 10 coin tosses right • Cancer clusters – how many cases before investigation • Weight gain treatment – one group gained an average of 1 pound more than other group…what if 10?
Why do we care about the z scores that define the middle 95% of the curve?Inferential Statistics Hypothesis testing with z scores allows us to make inferences about whether the sample mean is consistent with the known population mean. • Is the mean of my observed sample consistent with the • known population mean or did it come from some other • distribution?
Why do we care about the z scores that define the middle 95% of the curve? If the z score falls outside the middle 95% of the curve, it must be from some other distribution Main assumption: We assume that weird, or unusual or rare things don’t happen If a score falls out into the 5% range we conclude that it “must be” actually a common score but from some other distribution That’s why we care about the z scores that define the middle 95% of the curve
. Main assumption: We assume that weird, or unusual or rare things don’t happen I’m not an outlier I just haven’t found my distribution yet If a score falls out into the tails (low probability) we conclude that it “must be” a common score from some other distribution
. .. Reject the null hypothesis Relative to this distribution I am unusual maybe even an outlier 95% X Relative to this distribution I am utterly typical 95% X Support for alternative hypothesis
Rejecting the null hypothesis . notnull null big z score x x • If the observed z falls beyond the critical z in the distribution (curve): • then it is so rare, we conclude it must be from some other distribution • then we reject the null hypothesis • then we have support for our alternative hypothesis Alternative Hypothesis • If the observed z falls within the critical z in the distribution (curve): • then we know it is a common score and is likely to be part of this distribution, • we conclude it must be from this distribution • then we do not reject the null hypothesis • then we do not have support for our alternative . null x x small z score
Rejecting the null hypothesis • If the observed z falls beyond the critical z in the distribution (curve): • then it is so rare, we conclude it must be from some other distribution • then we reject the null hypothesis • then we have support for our alternative hypothesis • If the observed z falls within the critical z in the distribution (curve): • then we know it is a common score and is likely to be part of this distribution, • we conclude it must be from this distribution • then we do not reject the null hypothesis • then we do not have support for our alternative hypothesis
How do we know how rare is rare enough? Area in the tails is alpha α = .01 α = .10 α = .05 99% Level of significance is called alpha (α) • The degree of rarity required for an observed outcome • to be “weird enough” to reject the null hypothesis • Which alpha level would be associated with most “weird” or rare scores? 95% Critical z: A z score that separates common from rare outcomes and hence dictates whether the null hypothesis should be retained (same logic will hold for “critical t”) 90% If the observed z falls beyond the critical z in the distribution (curve) then it is so rare, we conclude it must be from some other distribution
Confidence Interval of 95%Has and alpha of 5%α = .05 Critical z 2.58 Critical z -2.58 Confidence Interval of 99% Has and alpha of 1% α = .01 99% Area in the tails is called alpha Critical z 1.96 Critical z -1.96 95% Critical Z separates rare from common scores 90% Critical z 1.64 Critical z -1.64 Confidence Interval of 90% Has and alpha of 10% α = . 10
Measurements that occur within the middle part of the curve are ordinary (typical) and probably belong there For scores that fall into the middle range, we do not reject the null Moving from descriptive stats into inferential stats…. Critical z 1.64 Critical z -1.64 90% 5% 5% Measurements that occur outside this middle ranges are suspicious, may be an error or belong elsewhere For scores that fall into the regions of rejection, we reject the null What percent of the distribution will fall in region of rejection Critical Values http://today.msnbc.msn.com/id/33411196/ns/today-today_health/ http://www.youtube.com/watch?v=0r7NXEWpheg
Rejecting the null hypothesis • The result is “statistically significant” if: • the observed statistic is larger than the critical statistic • observed stat > critical stat If we want to reject the null, we want our t (or z or r or F or x2) to be big!! • the p value is less than 0.05 (which is our alpha) • p < 0.05 If we want to reject the null, we want our “p” to be small!! • we reject the null hypothesis • then we have support for our alternative hypothesis A note on decision making following procedure versus being right relative to the “TRUTH”
. Decision making: Procedures versus outcome Best guess versus “truth” What does it mean to be correct? • Why do we say: • “innocent until proven guilty” • “not guilty” rather than “innocent” • Is it possible we got a verdict wrong?
. Type I or Type II error? . Does this airline passengerhave a snow globe? Null Hypothesis means she does not have a snow globe(that nothing unusual is happening) – Should we reject it???!! As detectives, do we accuse her of brandishing a snow globe?
. Does this airline passenger have a snow globe? Status of Null Hypothesis(actually, via magic truth-line) Are we correct or have we made a Type I or Type II error? False Ho Yes snow globe True Ho No snow globe You are wrong! Type II error(miss) Do not reject Ho“no snow globe move on” You are right! Correct decision Decision madeby experimenter You are wrong! Type I error(false alarm) Reject Ho “yes snow globe, stop!” You are right! Correct decision Note: Null Hypothesis means she does not have a snow globe (that nothing unusual is happening) – Should we reject it???!!
. Type I or type II error? True Ho False Ho You are right! Correct decision You are wrong! Type II error(miss) Do notReject Ho Decision madeby experimenter You are wrong! Type I error(false alarm) You are right! Correct decision Reject Ho Does this airline passenger have a snow globe? • Two ways to be correct: • Say she does have snow globe when she does have snow globe • Say she doesn’t have any when she doesn’t have any • Two ways to be incorrect: • Say she does when she doesn’t (false alarm) • Say she does not have any when she does (miss) Which is worse? What would null hypothesis be? This passenger does not have any snow globe Type I error: Rejecting a true null hypothesis Saying the she does have snow globe when in fact she does not (false alarm) Type II error: Not rejecting a false null hypothesis Saying she does not have snow globe when in fact she does (miss)
. Type I or type II error True Ho False Ho You are right! Correct decision You are wrong! Type II error(miss) Do notReject Ho Decision madeby experimenter You are wrong! Type I error(false alarm) You are right! Correct decision Reject Ho Does advertising affect sales? • Two ways to be correct: • Say it helps when it does • Say it does not help when it doesn’t help Which is worse? • Two ways to be incorrect: • Say it helps when it doesn’t • Say it does not help when it does What would null hypothesis be? This new advertising has no effect on sales Type I error: Rejecting a true null hypothesis Saying the advertising would help sales, when it really wouldn’t help people (false alarm) Type II error: Not rejecting a false null hypothesis Saying the advertising would not help when in fact it would (miss)
. What is worse a type I or type II error? True Ho False Ho You are right! Correct decision You are wrong! Type II error(miss) Do notReject Ho Decision madeby experimenter You are wrong! Type I error(false alarm) You are right! Correct decision Reject Ho What if we were lookingat a new HIV drug that had no unpleasant side affects • Two ways to be correct: • Say it helps when it does • Say it does not help when it doesn’t help • Two ways to be incorrect: • Say it helps when it doesn’t • Say it does not help when it does Which is worse? What would null hypothesis be? This new drug has no effect on HIV Type I error: Rejecting a true null hypothesis Saying the drug would help people, when it really wouldn’t help people (false alarm) Type II error: Not rejecting a false null hypothesis Saying the drug would not help when in fact it would (miss)
. Type I or type II error Which is worse? What if we were looking to see if there is a fire burning in an apartment building full of cute puppies • Two ways to be correct: • Say “fire” when it’s really there • Say “no fire” when there isn’t one • Two ways to be incorrect: • Say “fire” when there’s no fire (false alarm) • Say “no fire” when there is one (miss) What would null hypothesis be? No fire is occurring Type I error: Rejecting a true null hypothesis (false alarm) Type II error: Not rejecting a false null hypothesis (miss)
. Type I or type II error Which is worse? What if we were looking to see if an individualwere guilty of a crime? • Two ways to be correct: • Say they are guilty when they are guilty • Say they are not guilty when they are innocent • Two ways to be incorrect: • Say they are guilty when they are not • Say they are not guilty when they are What would null hypothesis be? This person is innocent - there is no crime here Type I error: Rejecting a true null hypothesis Saying the person is guilty when they are not (false alarm) Sending an innocent person to jail (& guilty person to stays free) Type II error: Not rejecting a false null hypothesis Saying the person in innocent when they are guilty (miss) Allowing a guilty person to stay free
. The null hypothesis is typically that something is not present, that there is no effect, that there is no difference between population and sample or between treatment and control. Null Hypothesis A measure of sickness people taking drugpeople not taking drug (There are two distributions here, they are just on top of each other) (overlapping) people taking drug people not taking drug A measure of sickness A measure of sickness Null is FALSE Null is TRUE Drug does have effect Something going on Nothing going on No effect of drug There is no difference between the groups There is a difference between the groups
Remember: “procedure” vs “TRUTH” . (There are two distributions here, they are just on top of each other) (overlapping) A measure of sickness people taking drug people not taking drug people taking drugpeople not taking drug A measure of sickness A measure of sickness Null is FALSE Null is TRUE Score should fall in this region critical stat critical stat critical stat critical stat Score should fall in one of these regions Score should fall in one of these regions Null is TRUE Null is FALSE No effect of drug Nothing going on Drug does have effect Something going on
. Two ways to be right: Status of Null Hypothesis(actually, via magic truth-line) True Ho False Ho Do notReject Ho Decision madeby experimenter Reject Ho 1. “Reject a false null hypothesis” “there really is something going on” 2. “Do not reject a true null hypothesis” “there really is no difference between groups” You are right! Correct decision You are right! Correct decision
. Two ways to be wrong: Status of Null Hypothesis(actually, via magic truth-line) True Ho False Ho Do notReject Ho Decision madeby experimenter Reject Ho 1. “Reject a true null hypothesis” say there’s a difference when there’s not (Type I)The score fell in the tails but the null was actually “TRUE” 2. “Do not reject a false null hypothesis” say there really is no difference between groupswhen there really is (Type II) The score fell in the middle but the null was still “FALSE” You are wrong! Type II error(miss) You are wrong! Type I error(false alarm)
Possible outcomes of hypothesis test Status of Null Hypothesis(actually, via magic truth-line) True Ho False Ho Do notReject Ho Decision madeby experimenter Reject Ho You are wrong! Type II error(miss) You are right! Correct decision You are wrong! Type I error(false alarm) You are right! Correct decision • Probability of rejecting a true null hypothesis = alpha • The alpha you choose becomes the probability of • making a Type I error
. What’s worse – Type I or Type II error? Status of Null Hypothesis(actually, via magic truth-line) True Ho False Ho Do notReject Ho Decision madeby experimenter Reject Ho . You are wrong! Type II error(miss) You are right! Correct decision You are wrong! Type I error(false alarm) You are right! Correct decision
Thank you! See you next time!!