Download
1 / 9
100 likes | 502 Views
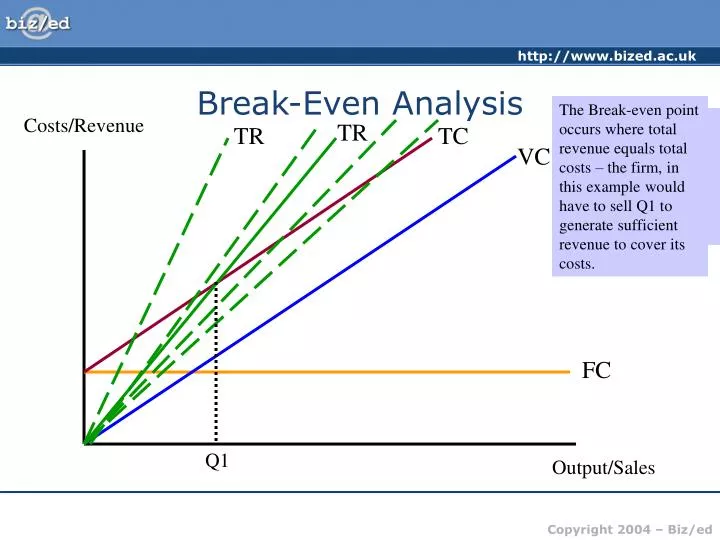
Break-Even Analysis. The Break-even point occurs where total revenue equals total costs – the firm, in this example would have to sell Q1 to generate sufficient revenue to cover its costs. As output is generated, the firm will incur variable costs – these vary directly with the amount produced.

E N D
Break-Even Analysis The Break-even point occurs where total revenue equals total costs – the firm, in this example would have to sell Q1 to generate sufficient revenue to cover its costs. As output is generated, the firm will incur variable costs – these vary directly with the amount produced The lower the price, the less steep the total revenue curve. Total revenue is determined by the price charged and the quantity sold – again this will be determined by expected forecast sales initially. The total costs therefore (assuming accurate forecasts!) is the sum of FC+VC Costs/Revenue TR TR TC Initially a firm will incur fixed costs, these do not depend on output or sales. VC FC Q1 Output/Sales
Break-Even Analysis Costs/Revenue If the firm chose to set price higher than £2 (say £3) the TR curve would be steeper – they would not have to sell as many units to break even TC TR (p = £3) TR (p = £2) VC FC Q2 Q1 Output/Sales
Break-Even Analysis TR (p = £1) Costs/Revenue If the firm chose to set prices lower (say £1) it would need to sell more units before covering its costs TR (p = £2) TC VC FC Q1 Q3 Output/Sales
Break-Even Analysis TR (p = £2) TC Costs/Revenue VC Profit Loss FC Q1 Output/Sales
Break-Even Analysis Margin of safety shows how far sales can fall before losses made. If Q1 = 1000 and Q2 = 1800, sales could fall by 800 units before a loss would be made A higher price would lower the break even point and the margin of safety would widen TR (p = £3) TC TR (p = £2) Costs/Revenue VC Assume current sales at Q2 Margin of Safety FC Q1 Q3 Q2 Output/Sales
Costs/Revenue Eurotunnel’s problem High initial FC. Interest on debt rises each year – FC rise therefore FC 1 FC Losses get bigger! TR VC Output/Sales
Break-Even Analysis • Remember: • A higher price or lower price does not mean that break even will never be reached! • The BE point depends on the number of sales needed to generate revenue to cover costs – the BE chart is NOT time related!
Break-Even Analysis • Importance of Price Elasticity of Demand: • Higher prices might mean fewer sales to break-even but those sales may take a longer time to achieve. • Lower prices might encourage more customers but higher volume needed before sufficient revenue generated to break-even
Break-Even Analysis • Links of BE to pricing strategies and elasticity • Penetration pricing – ‘high’ volume, ‘low’ price – more sales to break even • Market Skimming – ‘high’ price ‘low’ volumes – fewer sales to break even • Elasticity – what is likely to happen to sales when prices are increased or decreased?