Download
1 / 19
190 likes | 371 Views
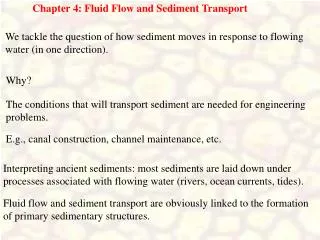
eWater Tools in Action – The Tamar and Esk Rivers Sediment Modelling using Source Catchments. 21 February 2011. eWater Road Show 21 Feb – Part 2 of 5. Tony Weber. Background. Sediment in the Tamar Estuary – Some Questions How much? Where is it coming from? Who might be contributing?

E N D
eWater Tools in Action – The Tamar and Esk Rivers Sediment Modelling usingSource Catchments 21 February 2011 eWater Road Show 21 Feb – Part 2 of 5 Tony Weber
Background • Sediment in the Tamar Estuary – Some Questions • How much? • Where is it coming from? • Who might be contributing? • What might the causes be? • Will it get worse? • How do we fix it?
Background • How to model using Source Catchments • Collect Data • Understand the catchment • Build a model • Check it is OK • Extract results • Check it is OK • Produce final results
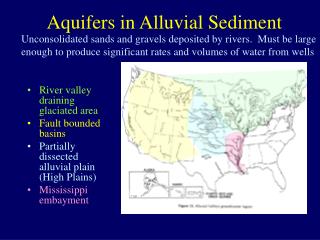
Mapping the Catchment • Major Catchments
Mapping the Catchment • Land Use
Mapping the Catchment • Point Sources
Building the Model • Subcatchment Definition
Building the Model • Node Link Network
Building the Model • Water Flow • Gauging stations • Real data
Building the Model • Water Quality
Model Analysis and Uncertainty • Needed to examine how “good” the model was • It’s possible that random numbers can be just as good • So ran 1000’s of parameter sets through the model • Compared to the “calibrated” results • Gave us an understanding of the uncertainty • Allowed us to refine the parameters significantly to reduce uncertainty • Also identified which parameters could be reliably derived from the data
Model Results • Basin Loads – TSS • % Distribution
Model Results • Broad Land Use Loads – TSS
Model Results • Spatial Distribution – TSS • Mean Annual Loads 3300 t/yr 0 t/yr
Model Results • Examining Scenarios
What does this all mean? • Sediment Sources
Learnings • TEER Catchment Modelling • Some of the most detailed modelling in Australia • High degree of certainty in results • Indicated areas to focus future management • These are simply tools and should be used as such • Partnering with industry – a two way street!
NEXT – Australia’s next gen modelling platformDr Peter Wallbrink