Download
1 / 6
60 likes | 267 Views
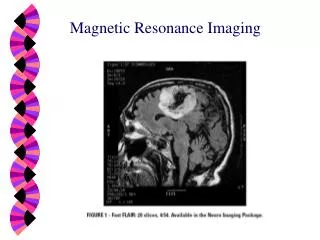
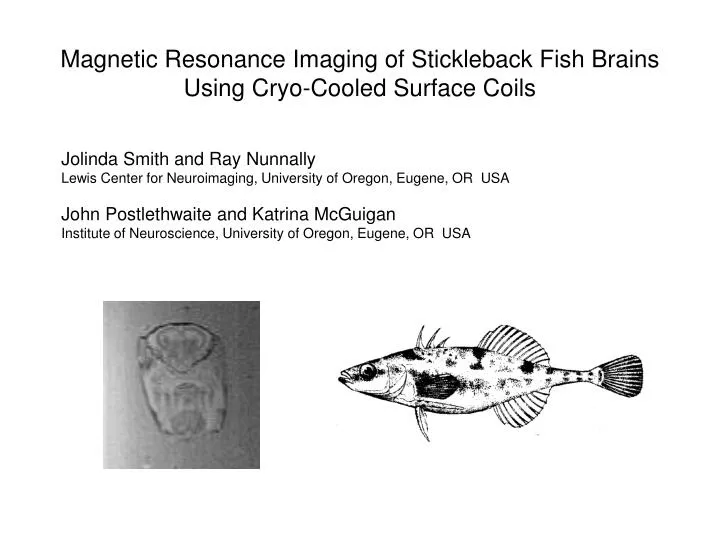
Magnetic Resonance Imaging of Stickleback Fish Brains Using Cryo-Cooled Surface Coils. Jolinda Smith and Ray Nunnally Lewis Center for Neuroimaging, University of Oregon, Eugene, OR USA John Postlethwaite and Katrina McGuigan Institute of Neuroscience, University of Oregon, Eugene, OR USA.

E N D
Magnetic Resonance Imaging of Stickleback Fish Brains Using Cryo-Cooled Surface Coils Jolinda Smith and Ray Nunnally Lewis Center for Neuroimaging, University of Oregon, Eugene, OR USA John Postlethwaite and Katrina McGuigan Institute of Neuroscience, University of Oregon, Eugene, OR USA
Male & female stickleback Threespine stickleback (Gasterosteus aculeatus) are a well established model for studying evolution, partly because of the dramatic morphological and behavioral variation among populations. Populations vary in sexual, foraging and predator avoidance behaviors and this variation could be driving speciation. As a model species, there is extensive information on the behavioral ecology of threespine stickleback. Magnetic resonance imaging could provide an opportunity to capitalize on this information and to develop further insight into behavioral responses of stickleback to particular cues. Neglecting noise from the sample, the gain from cooling a coil with liquid nitrogen will be: The resistance of a flat copper coil at temperature T is: where r is the coil radius, ρ is the room-temperature resistivity of copper, δρ is the thermal coefficient of resistance for copper, w is the copper trace width, and t is the temperature-dependant skin depth of copper at frequency f. Adult threespine stickleback fish are typically around 50 mm long, with a brain only 3 mm wide. Imaging structures on this scale requires careful coil design to maximize signal to noise ratios. For small coils and samples, image noise is dominated by resistive noise in the coil. In this case, significant gains may be achieved by cooling the coil to liquid nitrogen temperature (77K). Assuming that preamplifier noise is negligible, the noise in a magnetic resonance image may be given by the Nyquist formula: For any copper coil, the maximum SNR gain is: Actual gains are expected to be somewhat smaller due to sample and preamplifier noise. (1) where Nr is the rms value of the noise, kB is Boltzman’s constant, ∆f is the bandwidth of the detector, TC and RC are the temperature and resistance of the coil, and TS and RS are the temperature and effective resistance of the sample. If the resistive noise in the coil is greater than the noise from the sample, significant gains in signal to noise may be achieved by lowering the temperature of the coil (2). (1) Nyquist H. Phys Rev 1928; 32:110-113. (2) Wright AC, Song HK, Wehrli FW. Magn Reson Med 2000; 43:163-169.
We designed and built octagonally-shaped, 25 mm diameter surface coils inductively coupled to 19 mm diameter matching loops (above, left). Identical coils were built for comparison in air and liquid nitrogen. Each coil was tuned and matched for its operating environment and expected sample loading. The coils were held in a custom-built vacuum cryostat fabricated from G10, a fiber-reinforced plastic (above, center). The bottom of the cryostat introduced a spacing of 4.76 mm between the coil and the surface of the sample. The cryostat held 200 ml of liquid nitrogen. Cryogen was lost at a rate of about 1 mm per minute; the maximum imaging time without refilling the cryostat was about 40 minutes. The surface coil was used as a receive coil only; a Helmholtz pair at 90 degrees to the surface coil was used for transmission (above, right). Fish were euthanized before imaging and immobilized in a 1% agarose gel solution in a tissue culture flash. (right) The fish were imaged the same day the were killed. Other fish were imaged under anesthesia. The fish were anesthetized with ????, placed in a small container, and held in place with wet paper towels. The fish were revived after 30 minutes with no obvious ill effects.
77 K 300 K Spin-echo images of a sponge in phantom solution taken with a 1-inch diameter coil in air (above) and liquid nitrogen (below). Both coils were 4.8 mm above the sample. Tr = 300; Te = 18; flip angle = 90°, in-plane resolution = 125 microns, slice thickness = 0.4 mm, one average. 5 mm Axial slices through the midbrain of a stickleback fish. Proton-dense 2D turbo spin echo with TR = 3780 ms, TE = 20 ms, in-plane resolution 125 x 125 microns, slice thickness = 400 microns, flip angle = 154, 10 averages, total acquisition time = 25 min.
OT CC D OB V PT Pit Sagittal MR image of fish brain. Proton-dense 2D turbo spin echo with TR = 3780 ms, TE = 20 ms, inplane resolution 125 x 125 microns, slice thickness = 400 microns, flip angle = 154, 10 averages, acquisition time = 25 min. Click image above for movie; image below is slice #7. Bodian stain of a sagittal section through a stickleback brain (Ekstrom et. al., Journ. Comp. Neuro. 436, 2001, p 92) OB: olfactory bulb; D: area dorsalis telencephali; V: area ventralis telencephali; OT: optic tectum; CC: corpus cerebelli; PT: posterior tuberculum; Pit: pituitary 4X