Download
1 / 32
350 likes | 485 Views
The Generation of Melting Anomalies by Plate Tectonic Processes. Gillian R. Foulger University of Durham. .... based on ideas developed over several years by a working group that includes ....

E N D
The Generation of Melting Anomalies by Plate Tectonic Processes Gillian R. Foulger University of Durham
.... based on ideas developed over several years by a working group that includes .... Don Anderson, Warren Hamilton, Jerry Winterer, Jim Natland, Dean Presnall, Peter Vogt, Anders Meibom, Hetu Sheth, Seth Stein, Mike O’Hara & Alan Smith .... etc for more see www.mantleplumes.org
Two key elements: • Variations in lithosphere stress • Mantle inhomogeneity Simply put • Stress governs location of volcanism • Fusibility governs volume of magma
MELT experiment EPR Mantle dehomogenising • ridges
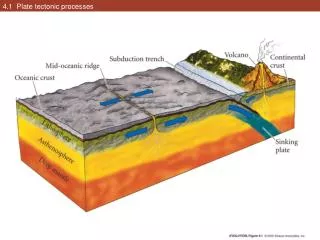
Mantle dehomogenising • ridges • subduction zones • eclogitisation of subducted crust
A 30/70 eclogite-peridotite mixture can generate several times as much melt as peridotite Pyrolite Eclogite Yaxley (2000) Eclogite is fusible
Mantle dehomogenising • metasomatism of oceanic and continental mantle lithosphere • delamination of thickened lithosphere, including lower crust • erosion of continental lithosphere during breakup Cantal basalts model, Massif Central, France Pilet et al. (2005)
Mantle dehomogenising • metasomatism of oceanic and continental mantle lithosphere • delamination of thickened lithosphere, including lower crust • erosion of continental lithosphere during breakup Schott et al. (2000)
Mantle dehomogenising • metasomatism of oceanic and continental mantle lithosphere • delamination of thickened lithosphere, including lower crust • erosion of continental lithosphere during breakup
Mantle dehomogenising adapted from Meibom & Anderson (2003)
Variations in stress • Lithosphere cooling • Spatial and temporal variations in plate boundary type & tectonics • Variations in lithosphere strength
Variations in stress • Lithosphere cooling • Spatial and temporal variations in plate boundary type & tectonics • Variations in lithosphere strength From Natland, 2004
Variations in stress • Lithosphere cooling • Spatial and temporal variations in plate boundary type & tectonics • Variations in lithosphere strength adapted from Lundin & Doré (2005)
Proposal “Hot spot” volcanism occurs where • stress is extensional • mantle is highly fusible
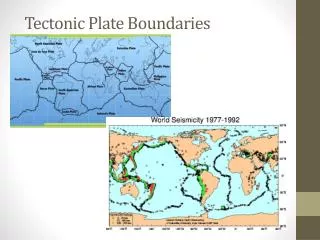
“Hot spots” on MORs • 1/3 of all “hot spots” are on or near MORs
East African Rift • Afar • Other EAR “hotspots”?
Basin & Range Province • Broad, intraplate extensional region • Associated with subduction of “Farallon slab” • Widespread volcanism
NAVP & Iceland • Formed when continent rifted along Iapetus suture • Diverse data suggest not hot • Recycled Iapetus crust can explain geochemistry & melt volume Closure of the Iapetus
Azores • Kinematic models • EQ focal mechanisms • bathymetry • suggest Azores branch is: • oblique, ultra-slow spreading (3-4 mm/yr) • diffuse plate boundary • dextral differential shear motion Lourenço et al. (1998)
Predictions • Melt volumes can be explained by lithosphere extension + source fertility • Vertical motions related to shallow tectonic processes • Upper mantle is inhomogeneous • Migration of volcanism = migration of locus of extension
Predictions • Seismic tomography anomalies indicate composition and melt, not only temperature • “Hot spot” lavas not required to be hot • Geochemistry can be explained by inhomogeneities in the shallow mantle
Temperature (Tp) from petrology • mid-ocean ridges: ~1280 - 1400˚C • Iceland: ~1280 - 1460˚C • Hawaii: ~1560˚C The only place on Earth hot enough for a weak upper-mantle plume is Hawaii
Seismology does not reliably detect them in the lower mantle
Iceland Vertical exaggeration x 10 DT ~ 200˚C DT ~ 60˚C Ritsema & Montagner (2003)
Example:whole-mantle tomography: Iceland Ritsema et al. 1999
Hudson Bay plume? Iceland: A plume from the core-mantle boundary? Bijwaard & Spakman (1999)
Resolution of the “whole-mantle plume” The data used by Bijwaard & Spakman have no resolution in the lower mantle (courtesy of Karason & van der Hilst) From Foulger et al. (2001)