Download
1 / 1
10 likes | 108 Views
Got Sleep? An Observational Study of Factors Affecting Sleep Among Moses Brown Students Amanda Jain, MPH Department of Mathematics, Moses Brown School, Providence RI. Introduction

E N D
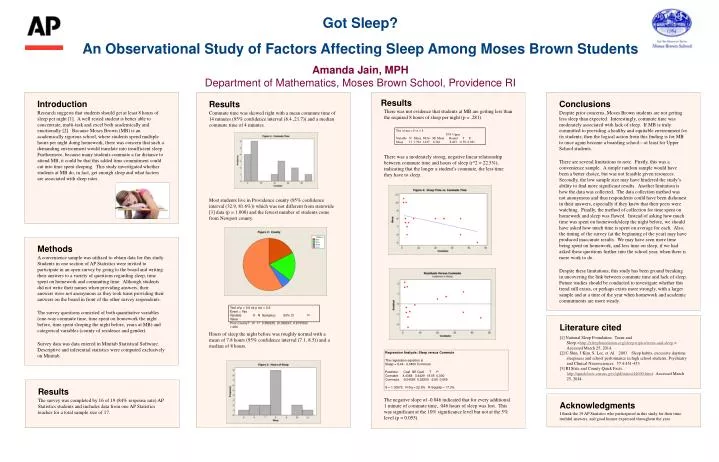
Got Sleep? An Observational Study of Factors Affecting Sleep Among Moses Brown Students Amanda Jain, MPHDepartment of Mathematics, Moses Brown School, Providence RI Introduction Research suggests that students should get at least 8 hours of sleep per night [1]. A well rested student is better able to concentrate, multi-task and excel both academically and emotionally [2]. Because Moses Brown (MB) is an academically rigorous school, where students spend multiple hours per night doing homework, there was concern that such a demanding environment would translate into insufficient sleep. Furthermore, because many students commute a far distance to attend MB, it could be that this added time commitment could cut into time spent sleeping. This study investigated whether students at MB do, in fact, get enough sleep and what factors are associated with sleep rates. Conclusions Despite prior concerns, Moses Brown students are not getting less sleep than expected. Interestingly, commute time was moderately associated with lack of sleep. If MB is truly committed to providing a healthy and equitable environment for its students, then the logical action from this finding is for MB to once again become a boarding school—at least for Upper School students. There are several limitations to note. Firstly, this was a convenience sample. A simple random sample would have been a better choice, but was not feasible given resources. Secondly, the low sample size may have hindered the study’s ability to find more significant results. Another limitation is how the data was collected. The data collection method was not anonymous and thus respondents could have been dishonest in their answers, especially if they knew that their peers were watching. Finally, the method of collection for time spent on homework and sleep was flawed. Instead of asking how much time was spent on homework/sleep the night before, we should have asked how much time is spent on average for each. Also, the timing of the survey (at the beginning of the year) may have produced inaccurate results. We may have seen more time being spent on homework, and less time on sleep, if we had asked these questions further into the school year, when there is more work to do. Despite these limitations, this study has been ground breaking in uncovering the link between commute time and lack of sleep. Future studies should be conducted to investigate whether this trend still exists, or perhaps exists more strongly, with a larger sample and at a time of the year when homework and academic commitments are more steady. There was not evidence that students at MB are getting less than the required 8 hours of sleep per night (p = .281). There was a moderately strong, negative linear relationship between commute time and hours of sleep (r^2 = 22.5%), indicating that the longer a student’s commute, the less time they have to sleep. The negative slope of -0.046 indicated that for every additional 1 minute of commute time, .046 hours of sleep was lost. This was significant at the 10% significance level but not at the 5% level (p = 0.055). Results Commute time was skewed right with a mean commute time of 14 minutes (95% confidence interval (6.4 ,21.7)) and a median commute time of 4 minutes. Most students live in Providence county (95% confidence interval (32.9, 81.6%)) which was not different from statewide [3] data (p = 1.000) and the fewest number of students come from Newport county. Hours of sleep the night before was roughly normal with a mean of 7.8 hours (95% confidence interval (7.1, 8.5)) and a median of 8 hours. Results Test of mu = 8 vs < 8 95% Upper Variable N Mean StDev SE Mean Bound T P Sleep 17 7.794 1.437 0.348 8.403 -0.59 0.281 Methods A convenience sample was utilized to obtain data for this study. Students in one section of AP Statistics were invited to participate in an open survey by going to the board and writing their answers to a variety of questions regarding sleep, time spent on homework and commuting time. Although students did not write their names when providing answers, their answers were not anonymous as they took turns providing their answers on the board in front of the other survey respondents. The survey questions consisted of both quantitative variables (one-way commute time, time spent on homework the night before, time spent sleeping the night before, years at MB) and categorical variables (county of residence and gender). Survey data was data entered in Minitab Statistical Software. Descriptive and inferential statistics were computed exclusively on Minitab. Test of p = 0.6 vs p not = 0.6 Event = Yes Variable X N Sample p 95% CI P-Value Prov County? 10 17 0.588235 (0.329247, 0.815563) 1.000 Literature cited [1] National Sleep Foundation. Teens and Sleep.<http://sleepfoundation.org/sleep-topics/teens-and-sleep.>. Accessed March 25, 2014. [2] C Shin, J Kim, S. Lee, et. Al. 2003. Sleep habits, excessive daytime sleepiness and school performance in high school students. Psychiatry and Clinical Neurosciences. 57:4:451-453 [3] RI State and County Quick Facts. http://quickfacts.census.gov/qfd/states/44000.html. Accessed March 25, 2014. Regression Analysis: Sleep versus Commute The regression equation is Sleep = 8.44 - 0.0460 Commute Predictor Coef SE Coef T P Constant 8.4388 0.4429 19.05 0.000 Commute -0.04595 0.02205 -2.08 0.055 S = 1.30672 R-Sq = 22.5% R-Sq(adj) = 17.3% Results The survey was completed by 16 of 19 (84% response rate) AP Statistics students and includes data from one AP Statistics teacher for a total sample size of 17. Acknowledgments I thank the 19 AP Statistics who participated in this study for their time, truthful answers, and good humor expressed throughout the year.