Download
1 / 10
120 likes | 468 Views
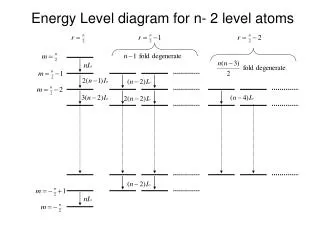
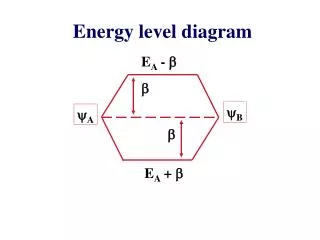
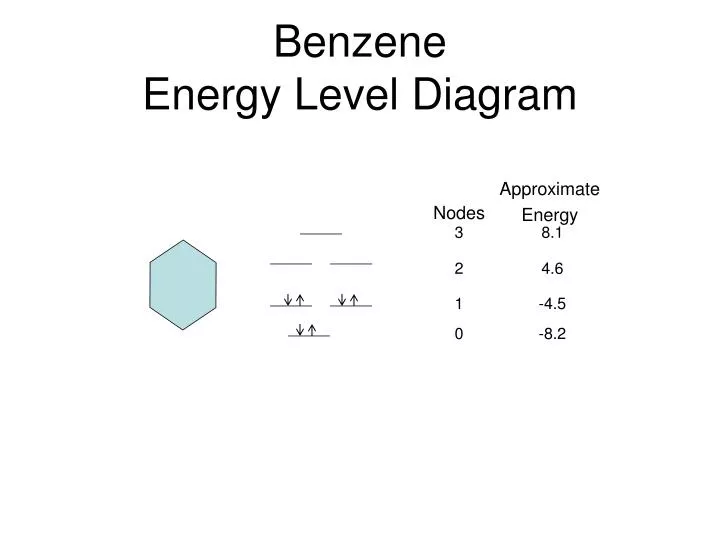
Benzene Energy Level Diagram. Approximate Energy. Nodes. 3. 8.1. 2. 4.6. 1. -4.5. 0. -8.2. P orbital 0 nodes lowest Energy. p orbital 1 node. p orbital 1 node. orbital 2 nodes. orbital 2 nodes. orbital 3 nodes, highest Energy orbital.

E N D
BenzeneEnergy Level Diagram Approximate Energy Nodes 3 8.1 2 4.6 1 -4.5 0 -8.2
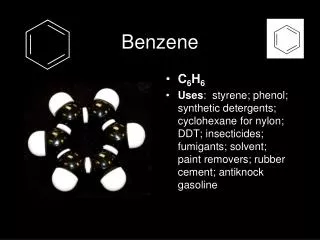
C6H6 Benzene Notice that all C-C bond lengths are all 1.40 Å.